Reporting and KPIs
How to Create a Drill-through in Power BI
How to set up a drill-through in Power BI: add a details page, add the field to the Drillthrough filters well, and open it with a right-click.
Sajagan Thirugnanam
·
Updated
To create a drill-through in Power BI, build a details page, then drag the field you want to filter by into the Drillthrough filters well in the Visualizations pane. Power BI adds a back button to that page automatically. A reader right-clicks a data point on a visual that contains the same field, chooses Drillthrough, and picks the page to open it, already filtered to that value.
What a drill-through is
A drill-through moves a reader from a summary page to a separate, more detailed page, filtered to the data point they clicked. Clicking a territory's total on a summary visual, for example, can open a second page showing every city and customer count inside that territory.
This is different from drilling down. Drilling down moves through a hierarchy inside one visual, such as going from yearly to monthly sales on the same chart. Drill-through leaves the visual and opens a different report page instead.
How to set up drill-through in Power BI
Step 1: Create a high-level summary page
Add a new report page with the + at the bottom of the canvas and give it a name that describes what it shows. This is the page a reader opens first, with summarized numbers such as total customers by territory.
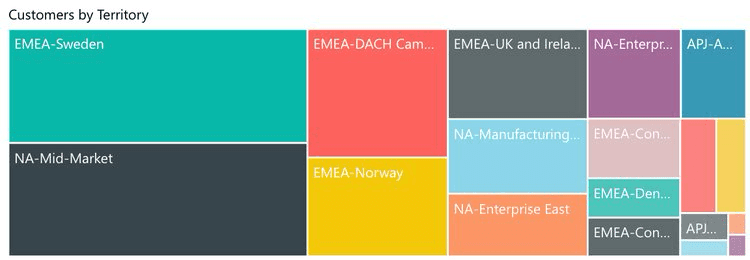
A summary page: a treemap of total customers by territory.
Step 2: Create a details page for drill-through
Add another report page and name it for what it will show, for example "Breakdown by Country/City." Build a visual on it with the more detailed breakdown you want a reader to be able to reach.
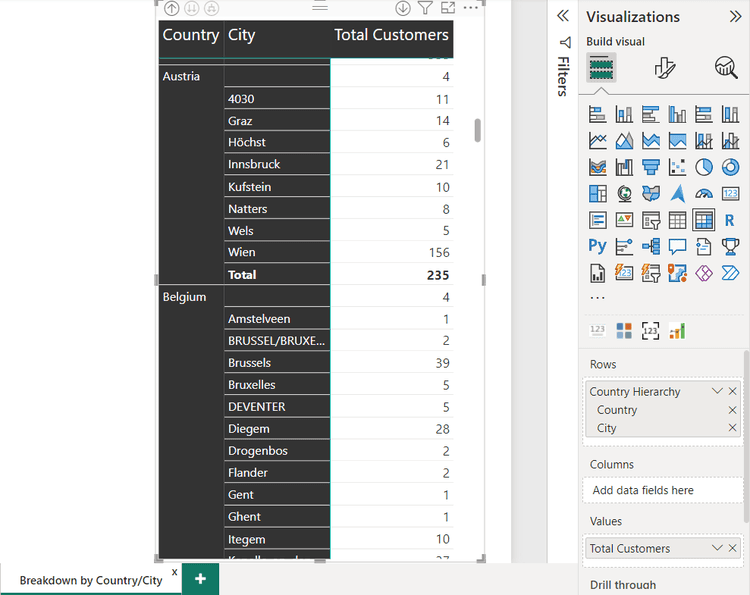
The details page: a matrix broken down by country and city, instead of by territory.
This example uses a matrix, but any visual type that can show the field you are drilling into works.
Step 3: Add the drillthrough field
On the details page, open the Visualizations pane and find the Drillthrough section near the bottom. Drag the field the summary page will filter by, Territory in this example, from the Data pane into the Drillthrough filters well.
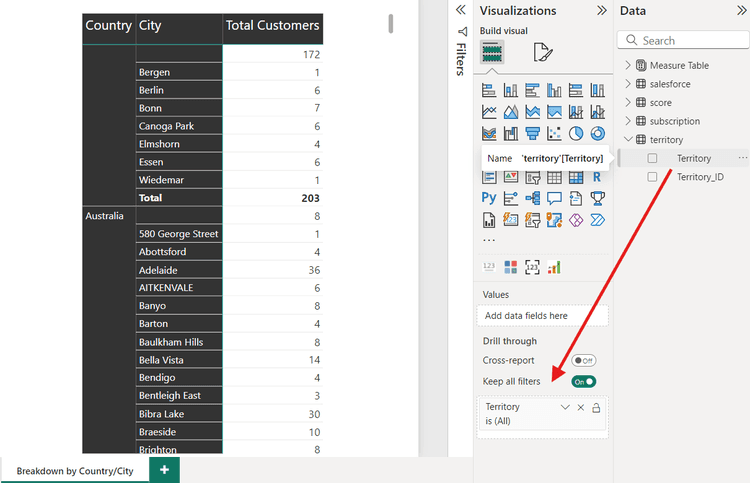
Dragging the Territory field into the Drillthrough filters well adds it as the link field and adds a back button to the page.
The Drillthrough section also shows a Cross-report toggle and a Keep all filters toggle. Cross-report only matters when the details page lives in a different, separately published report. Both reports need to sit in the same workspace. Cross-report drillthrough needs to be turned on in the target report's own settings, and the field names and types need to match exactly.
Once the field is added, right-click still only shows Drillthrough for a visual that contains that same field, unaggregated. If the option is missing from the menu, that is usually why. Hide the details page's tab so it does not appear as its own page in the report's navigation, then go back to the summary page.
Step 4: Use the drill-through
Right-click a data point on the summary visual, point to Drillthrough, and select the page you built.
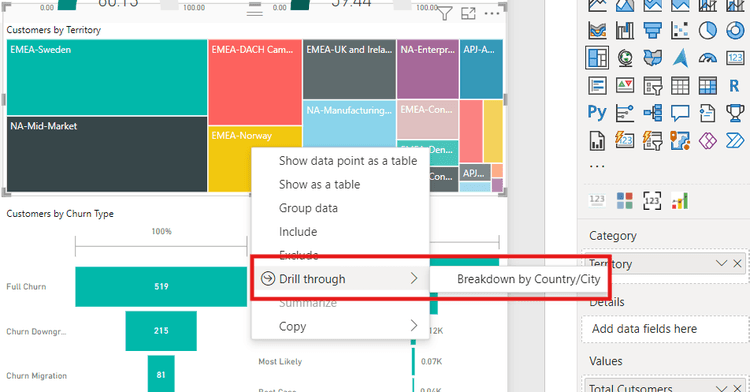
Right-clicking a territory on the summary visual shows Drillthrough and the target page name.
This opens the details page filtered to the value that was clicked.
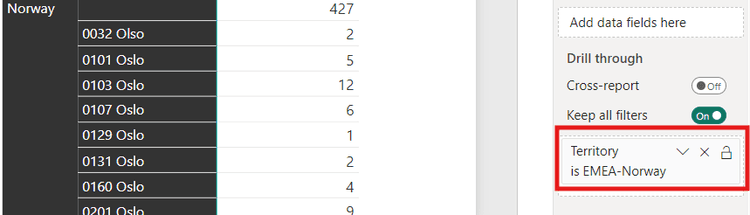
The details page opens filtered to the value clicked on the summary page, shown here as "Territory is EMEA-Norway."
A visual is not limited to one target page. Add the same field to more than one page's Drillthrough filters well, and the right-click menu lists each page as a separate option.
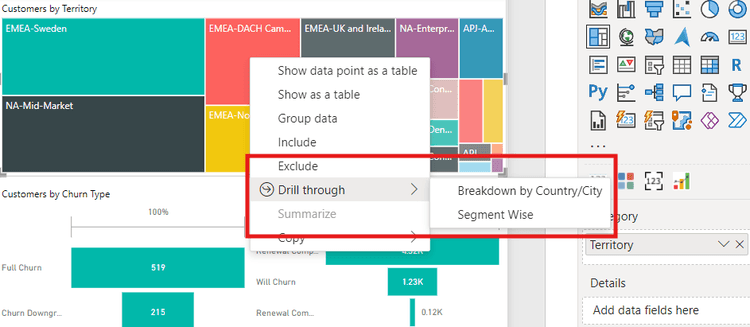
One summary visual can drill through to more than one details page; the menu lists each one.
In Desktop, these pages appear on the menu in the same order as their tabs. After the report is published to the Power BI service, that order can differ from the tab order.
Best practices for drill-through pages
Add a visible way in. A right-click menu is easy to miss on first use. Insert a button, set its Action to Drillthrough, and select the target page, so a reader has something to click instead of having to discover the menu.
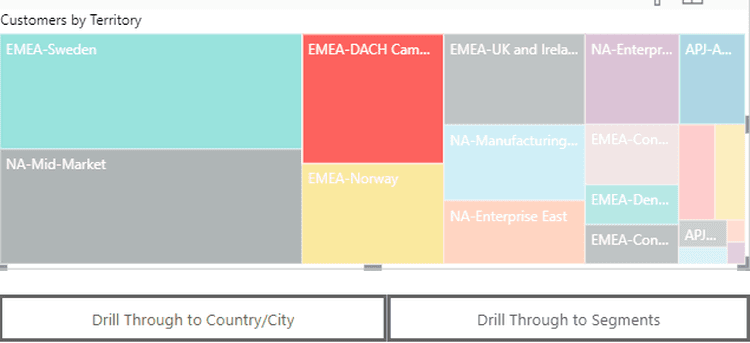
Buttons set to Drillthrough give a reader a visible click target instead of relying on the right-click menu.
Keep the details page focused. Show only the fields relevant to the drill-through, rather than everything available in the model, so the page stays readable once it is filtered down to one value.
Watch performance on large models. A details page with a wide matrix or a complex visual can be slower to load once real filter context is applied. Test it against a realistic filter, not an empty page.
A drill-through changes which page a reader sees, filtered by whatever they clicked. It carries the filter context from the summary page with it, so it works alongside the report's other filters and slicers rather than replacing them; see our guide to Power BI filters for how those interact. A field parameter cannot be used as the link field for a drill-through; see our guide to field parameters for what a field parameter can and cannot do. For a detail that fits in a small hover window instead of a full page, a tooltip is usually the better fit.
FAQs
What is the difference between drill down and drill through?
Drill down moves through a hierarchy inside the same visual, such as going from yearly to monthly sales on one chart. Drill through opens a separate report page, filtered to the value clicked, such as a page of detailed transactions for one product. Drill down stays inside one visual; drill through navigates to a different page.
Can I drill through on a table or matrix visual?
Yes. Drill-through works on tables and matrices as well as on charts such as bar and line charts, as long as the visual contains the field set up in the target page's Drillthrough filters well.
Sources
Use drillthrough in Power BI Desktop reports - Microsoft Learn
