Reports and Dashboards
Written By: Sajagan Thirugnanam
Last Updated on September 23, 2026
A Power BI report page tooltip replaces the small default hover box with a full custom page of visuals, cards, and charts that appears when a reader hovers over a data point. You build the page like any other report page, then register it as a tooltip in the Page Information card and connect it to a field in the Tooltip fields well.
Default Tooltip vs. Report Page Tooltip
Power BI shows a basic tooltip automatically on every visual: a small box listing the field values at the point you're hovering over, with no setup required. A report page tooltip replaces that box with a page you design yourself, which can hold a card, a small chart, or a mini table instead of plain text. This post covers building the custom kind.
How to Build a Report Page Tooltip
Create a new report page (the + button in the page tabs).
In the Format pane, open Canvas settings and set the page size Type to Tooltip, a canvas size built for this purpose.
Switch Page View to Actual Size (View tab in Desktop) so you're building at the size the tooltip will actually appear, since the default Fit to page view isn't representative.
Name the page in the Page Information card, then add the visuals you want the tooltip to show, typically a card or two plus a small chart or table.
In the same Page Information card, turn the Tooltip slider to On.
Drag the field that should trigger this tooltip into the Tooltip fields well in the Visualizations pane. Any visual elsewhere in the report containing that field now shows this page instead of the default hover box.
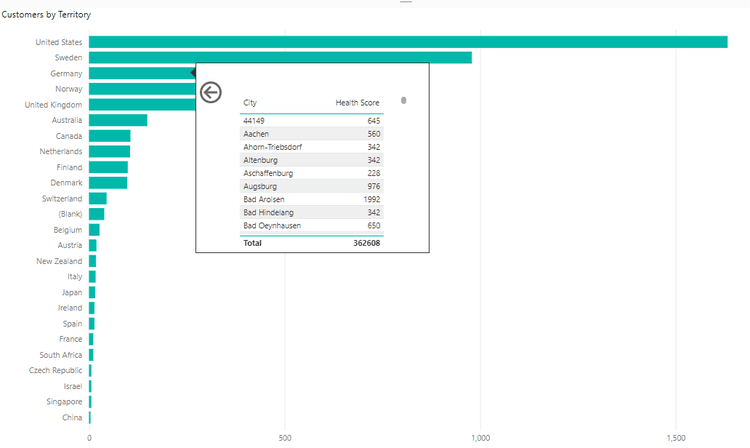
A custom report page tooltip, showing a city-level breakdown table instead of the default hover text.
You can also assign a tooltip page to one specific visual by hand: select the visual, open the Format pane's Tooltips card, and pick the page from the Page dropdown. This overrides the automatic field match, useful when a visual has two fields that each have their own tooltip page and only one should apply.
Limitations Worth Knowing
Not interactive. A reader can't click a slicer, scroll, or tab through a report page tooltip. Design it so everything fits without scrolling.
Dashboards don't support them. A Power BI dashboard, the pinned-tile object built in the service, falls back to the default tooltip even if the underlying report has a custom one. Report page tooltips only work inside the report itself.
One tooltip per line chart series. A line chart with a report page tooltip shows a single combined tooltip for every line, not one per line, matching how the default tooltip already behaves on that visual.
If a reader needs to interact with the extra detail, not just glance at it, a report page tooltip is the wrong tool. Use drill-through instead, which sends the reader to a full, filterable page.
Practical Uses
A sales chart's tooltip can show a small trend line or a comparison to target, so a reader gets the context without leaving the main page.
A revenue figure's tooltip can show a breakdown chart of what makes up that number, such as revenue by product line.
Anything shown in a tooltip is still subject to whatever filters are active on the page the reader is hovering on, since the tooltip page inherits that context. For the design decisions behind what belongs on the main page versus a tooltip, see our guide to dashboard design.
FAQs
Can I create a custom tooltip in Power BI?
Yes. Build a report page, set its page size type to Tooltip, turn on the Tooltip toggle in Page Information, and add the field that should trigger it to the Tooltip fields well. The page can hold a card, a chart, or a table, not just text.
Why are the tooltips not showing in the Power BI chart?
The most common cause is a mismatch between the field driving the tooltip and the summarization used in the visual; the tooltip only appears when they match. It can also be that the tooltip page's visuals have no data for the point you're hovering over, or that the tooltip content doesn't fit the page size and gets cut off. Check the field match first, then simplify the tooltip page if the problem continues.
Sources
Create report tooltips in Power BI - Microsoft Learn
Related to Reports and Dashboards