Power BI Tutorials
Written By: Sajagan Thirugnanam and Austin Levine
Last Updated on November 1, 2024
In today's data-driven world, organizations require robust tools to create detailed and structured reports that effectively communicate insights.
Power BI Report Builder is a specialized application designed to meet this need by enabling users to create paginated reports—highly formatted, multi-page documents suitable for printing and formal distribution.
This blog post will explore what Power BI Report Builder is, its key features, benefits, and practical usage within organizations.
Understanding Power BI Report Builder
What is Power BI Report Builder?

Source: Hevo Data
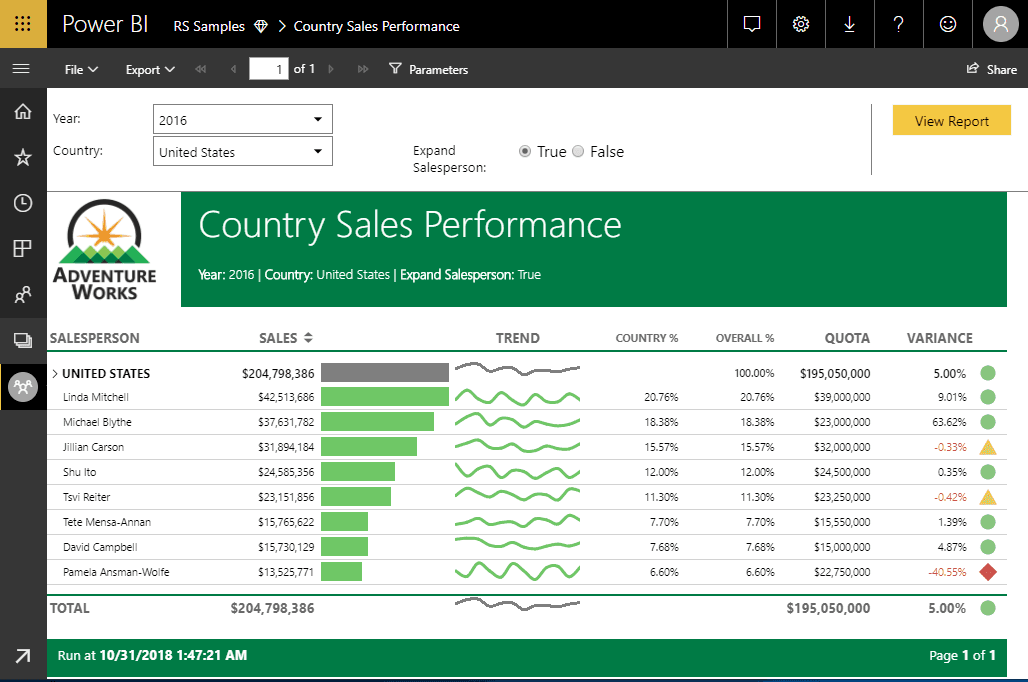
Power BI Report Builder is a standalone tool that allows users to design and create paginated reports for the Power BI service.
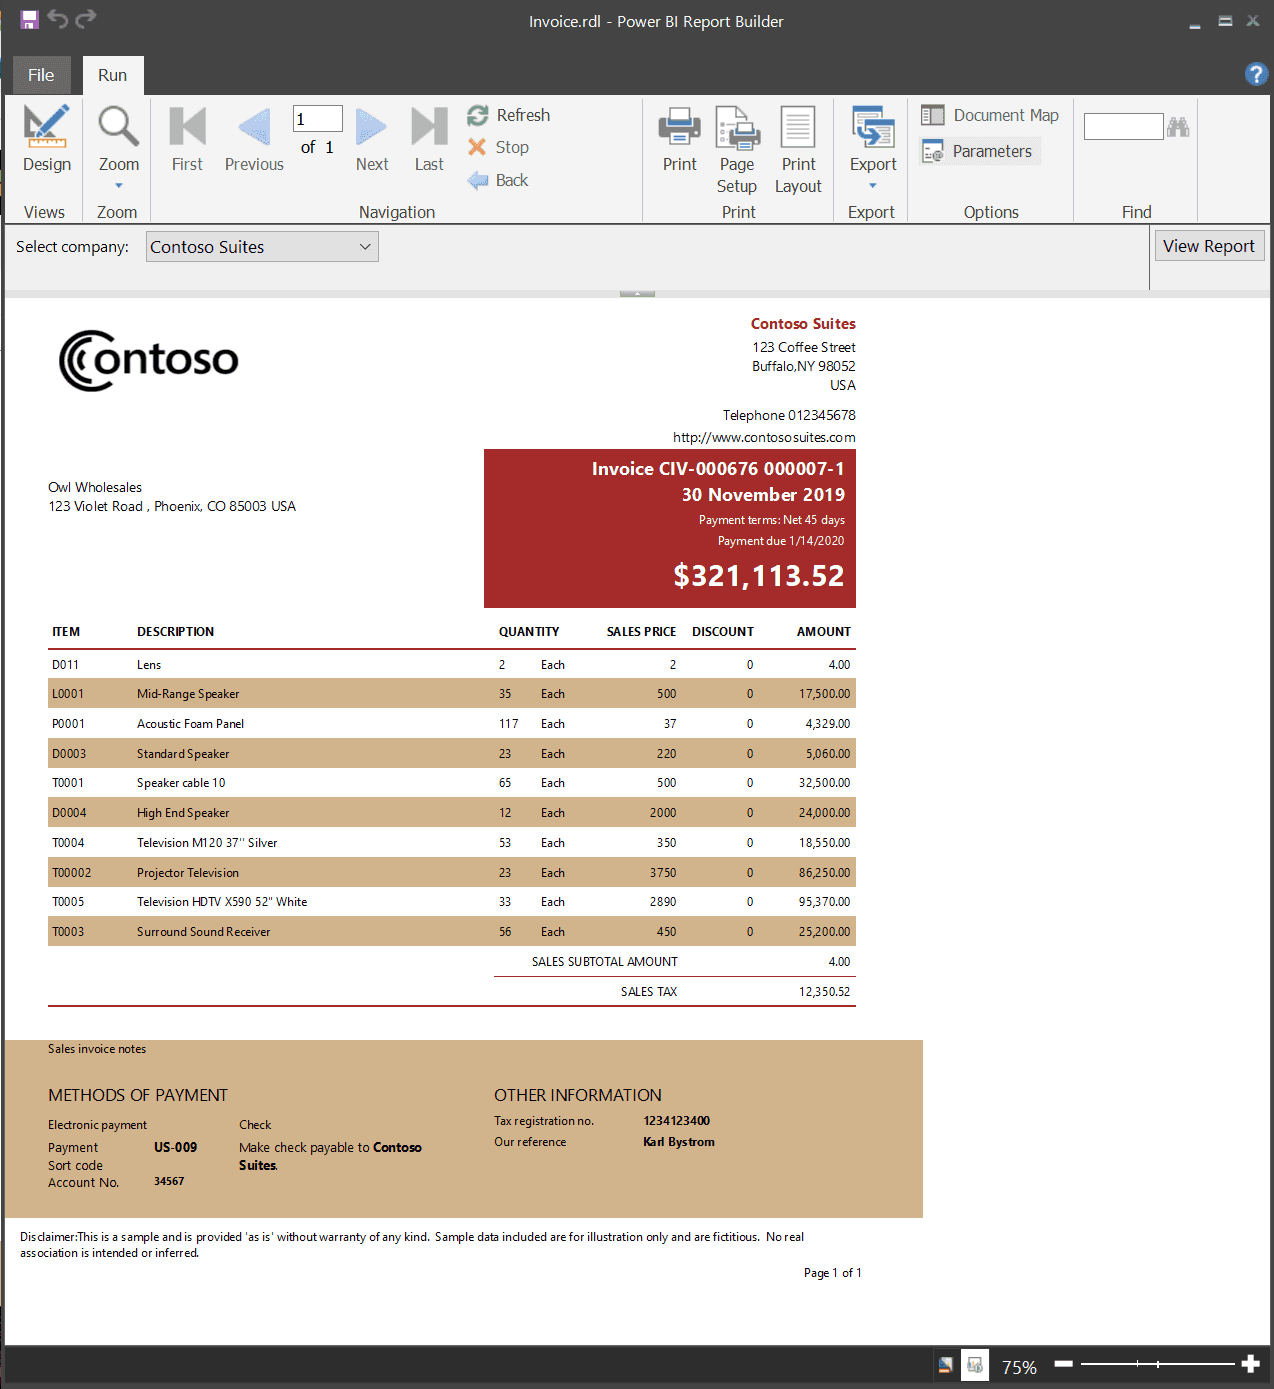
Unlike traditional Power BI reports that emphasize interactivity and visualizations, paginated reports are tailored for scenarios where precise formatting and detailed data presentation are essential. This makes them ideal for generating financial statements, invoices, operational reports, and other formal documentation.
Key Features of Power BI Report Builder
User-Friendly Interface: The drag-and-drop interface simplifies the report creation process, allowing users to add tables, charts, images, and text boxes without extensive programming knowledge.
Pixel-Perfect Layouts: Power BI Report Builder excels at producing pixel-perfect reports, ensuring that every element is precisely positioned. This is crucial for compliance with corporate standards or regulatory requirements.
Dynamic Parameters: Users can implement parameters that allow report viewers to filter data dynamically. This feature enhances user engagement by enabling tailored views based on specific criteria.
Multiple Export Formats: Reports can be exported in various formats such as PDF, Word, Excel, and CSV. This flexibility facilitates easy sharing of insights with stakeholders who may not have access to Power BI.
Integration with Data Sources: Power BI Report Builder supports a wide range of data sources, including SQL Server databases, Azure SQL Database, Oracle databases, and Power BI datasets. This capability ensures that users can create reports based on the most relevant data available.
Scheduled Reporting: Users can automate the delivery of reports on a scheduled basis, ensuring timely dissemination of critical information without manual intervention.
Advanced Data Manipulation: The tool allows users to group, filter, sort data, and add calculations or expressions directly within the report design.
Benefits of Using Power BI Report Builder

Source: Microsoft lens
Power BI Report Builder provides several advantages that enhance reporting capabilities within organizations:
Detailed Data Presentation
Paginated reports are designed to present large volumes of data in a structured format that spans multiple pages. This level of detail is particularly beneficial for generating comprehensive reports that require extensive data analysis.
Print-Ready Documents
The ability to create print-ready documents is a significant advantage of paginated reports. Organizations often need formal documentation for audits or compliance reporting; Power BI Report Builder ensures these documents are professionally formatted.
Improved Accessibility
Reports created in Power BI Report Builder can be shared with users who may not have access to interactive dashboards or other report types in Power BI. This inclusivity ensures critical insights are available to all stakeholders involved in decision-making processes.
Enhanced Data Exploration
While traditional Power BI reports focus on interactivity through visualizations, paginated reports complement this by offering structured reporting options that cater to both analytical and operational needs.
Consistency and Standardization
Power BI Report Builder helps maintain consistency in reporting formats across the organization. This standardization is vital for compliance with internal policies or external regulations.
How to Use Power BI Report Builder
Creating paginated reports using Power BI Report Builder involves several steps:
Step 1: Download and Install
To get started with Power BI Report Builder:
Download it from the official Microsoft website.
Install the application on your computer following the installation prompts.
Step 2: Connect to Your Data Source
After installation:
Open Power BI Report Builder.
Click on "New" and select "Blank Report."
Connect to your desired data source (e.g., SQL Server or Azure SQL Database) by selecting "Data Sources" from the menu.
Step 3: Design Your Report
Utilize the drag-and-drop interface:
Add tables or matrices for displaying detailed data.
Incorporate charts for visual representation where necessary.
Use text boxes for titles, headers, footers, and descriptions.
Implement parameters for dynamic filtering options by navigating to the "Parameters" section.
Step 4: Preview Your Report
Before finalizing your report:
Use the preview feature in Report Builder to check how your report will look when rendered.
Ensure all elements are correctly formatted and positioned.
Step 5: Publish Your Report
Once satisfied with your design:
Save your report locally.
Publish it directly to the Power BI service by selecting the appropriate workspace.
Manage access permissions accordingly so stakeholders can view or interact with the report as needed.
Best Practices for Using Power BI Report Builder
To maximize effectiveness when using Power BI Report Builder:
Define Clear Objectives
Before starting a new report project, define its purpose clearly and understand what information needs to be conveyed along with who the intended audience is.
Optimize Data Queries
Ensure that queries used to populate your reports are optimized for performance; this leads to faster loading times and better user experiences.
Maintain Consistent Formatting
Consistency across all paginated reports enhances professionalism and readability; use standardized fonts, colors, and layouts aligned with your organization’s branding guidelines.
Regularly Review Reports
Establish a routine for reviewing existing reports; as business needs evolve over time, so should your reporting content.
Common Challenges with Power BI Report Builder
While using Power BI Report Builder can significantly enhance reporting capabilities, some challenges may arise:
Learning Curve
For new users unfamiliar with reporting tools or SQL queries, there may be a learning curve associated with using Power BI Report Builder effectively.
Solution: Provide training sessions or resources that familiarize team members with both basic functionalities and advanced features of the tool.
Complexity in Configuration
Setting up complex paginated reports may seem daunting initially due to their detailed nature.
Solution: Start small by creating simpler reports before gradually increasing complexity as you become more comfortable with the tool's capabilities.
Conclusion
Power BI Report Builder serves as an essential tool for organizations seeking detailed and structured data presentations through paginated reports. With its ability to generate print-ready documents, support dynamic filtering through parameters, and integrate seamlessly into the broader Power BI ecosystem, it offers significant advantages over traditional reporting methods.
By understanding what Power BI Report Builder is and how it can be effectively utilized within your organization—along with following best practices—you can enhance your reporting capabilities significantly. Whether you need formal documentation for compliance purposes or detailed operational insights for internal stakeholders, leveraging this powerful tool will help you meet diverse business needs effectively.
Embrace Power BI Report Builder today and elevate your organization's reporting strategy!
Related to Power BI Tutorials