Power BI Tutorials
Written By: Sajagan Thirugnanam and Austin Levine
Last Updated on November 1, 2024
In the world of business intelligence, the ability to present data in a clear, structured, and comprehensive manner is crucial. Power BI offers various reporting options, among which paginated reports stand out as a powerful tool for generating formatted, print-ready documents. This blog post will delve into what Power BI paginated reports are, their key features, benefits, and how they can be effectively utilized within your organization.
Understanding Paginated Reports
What are Paginated Reports?

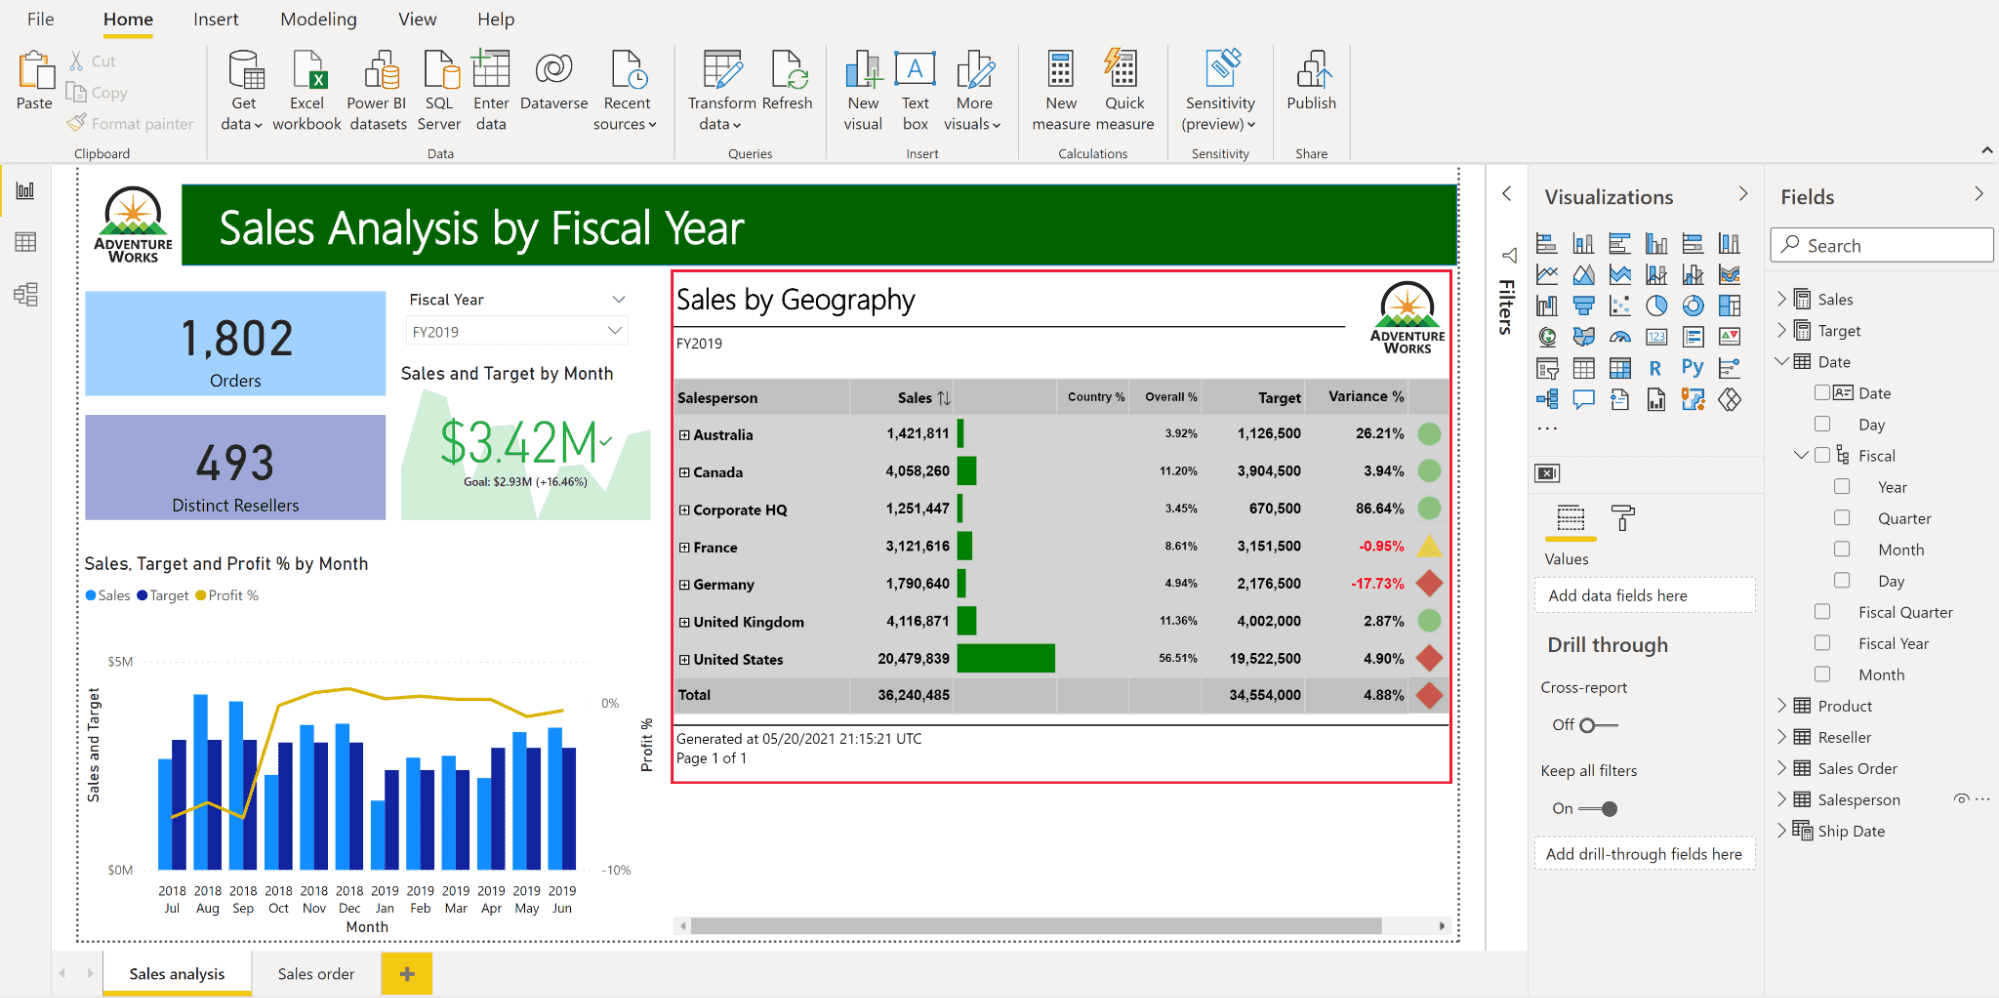
Source: Microsoft.com
Paginated reports in Power BI are designed to display data in a highly formatted manner that spans multiple pages. Unlike traditional Power BI reports that focus on interactive data visualization, paginated reports are ideal for scenarios where detailed data presentation is necessary. They allow users to create reports that can be printed or exported to various formats such as PDF or Excel, making them suitable for formal documentation and distribution.
Key Features of Paginated Reports
Detailed Data Presentation
Paginated reports can present large volumes of data in a structured format, allowing users to include tables, charts, and other elements that can span multiple pages. This is particularly useful for financial statements, invoices, and operational reports where comprehensive data analysis is required.
Customizable Layouts
Users have full control over every aspect of their report design using the Power BI Report Builder tool. This includes adjusting margins, headers, footers, and page sizes to fit specific business requirements.
Parameter Support
Paginated reports support parameters that allow users to filter data dynamically. This feature enhances the interactivity of the report while maintaining its structured format.
Export Options
Reports can be exported in various formats such as PDF, Word, Excel, and CSV. This flexibility makes it easy to share insights with stakeholders who may not have access to Power BI.
Integration with Power BI Service
Paginated reports can be published and managed in the Power BI service alongside other report types, facilitating centralized access and management.
Rendering Options
Paginated reports are optimized for printing and PDF generation, ensuring that they maintain their formatting across different platforms and devices.
Benefits of Using Paginated Reports

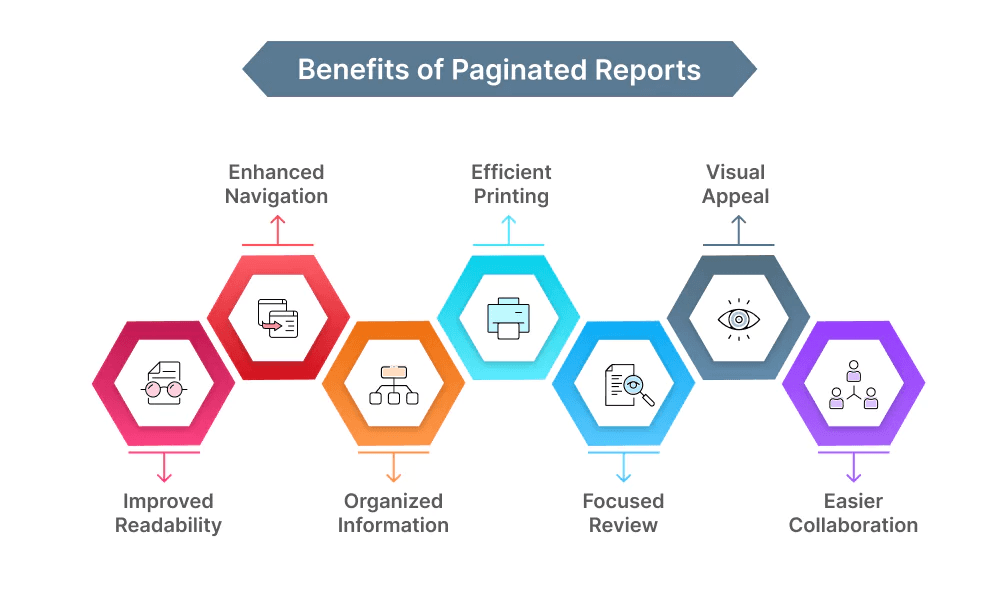
Source: Bold Reports
Paginated reports offer several advantages that make them a valuable addition to any organization’s reporting toolkit:
Enhanced Data Detail
Paginated reports excel at presenting detailed information in a clear and organized manner. They allow organizations to produce comprehensive documents that meet specific formatting requirements, essential for legal compliance or formal presentations.
Print-Ready Format
The ability to create print-ready documents is a significant advantage of paginated reports. Organizations often require formal documentation for audits, compliance reporting, or stakeholder presentations. Paginated reports ensure that these documents are well-formatted and professional.
Dynamic Filtering
With parameter support, users can create dynamic paginated reports that allow viewers to filter the data based on specific criteria. This feature not only enhances user experience but also ensures that stakeholders receive relevant information tailored to their needs.
Centralized Management
By integrating paginated reports into the Power BI service, organizations can manage all their reporting needs from a single platform. This centralization simplifies access control and version management while ensuring consistency across all reporting formats.
Improved Accessibility
Paginated reports can be shared with users who may not have access to Power BI dashboards or interactive reports. This inclusivity ensures that critical insights are available to all stakeholders involved in decision-making processes.
Leveraging Existing Datasets
Paginated reports can utilize existing datasets stored in the Power BI service or other sources like SQL Server or Azure SQL Database. This capability ensures that the reports are always up-to-date and consistent with other Power BI content while taking advantage of features like row-level security.
How to Create Paginated Reports

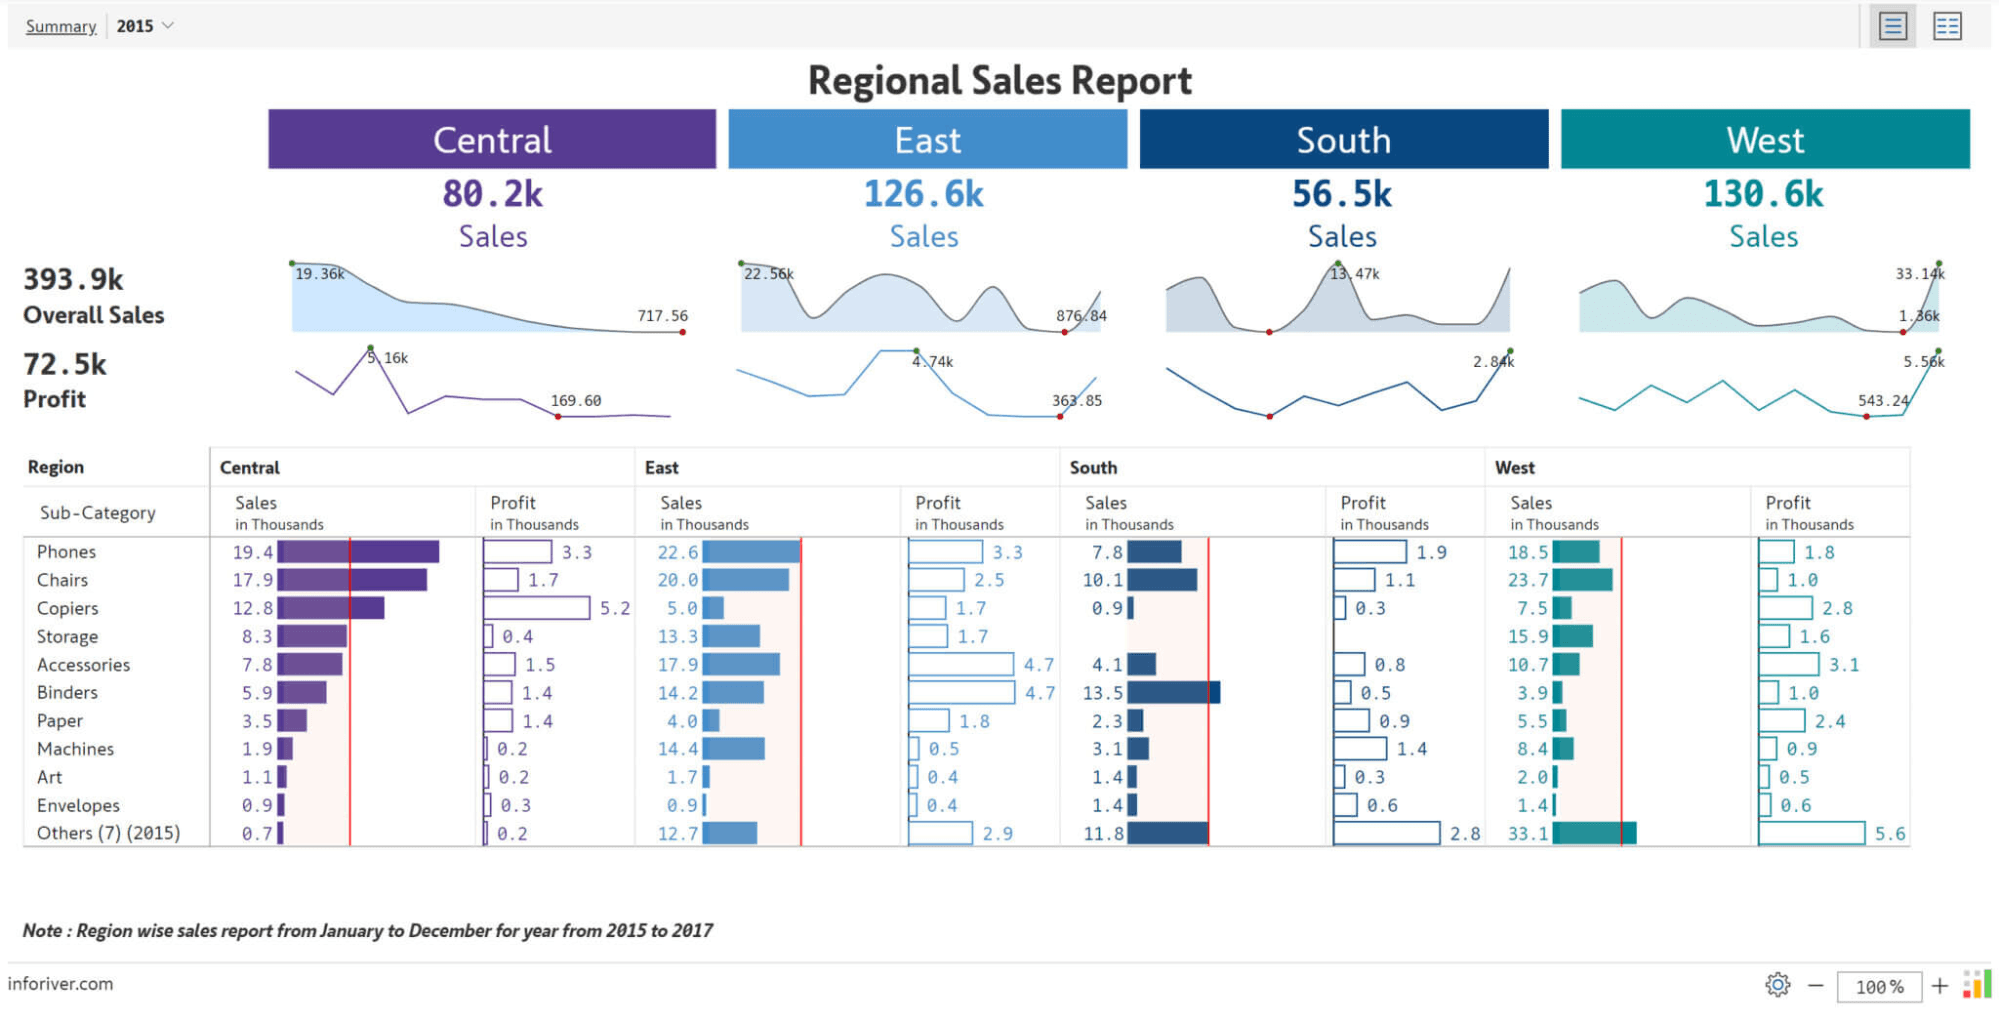
Source: Inforiver
Creating paginated reports involves several steps using Power BI Report Builder or directly within the Power BI service:
Step 1: Install Power BI Report Builder
To get started with paginated reports, download and install Power BI Report Builder from the Microsoft website. This standalone application is specifically designed for creating and editing paginated reports.
Step 2: Connect to Your Data Source
Open Power BI Report Builder and connect to your desired data source (e.g., SQL Server, Azure SQL Database). You can also use datasets already published in the Power BI service.
Step 3: Design Your Report
Utilize the drag-and-drop interface in Report Builder to design your report layout:
Add tables or matrices to display detailed data.
Incorporate charts for visual representation where necessary.
Use text boxes for titles, headers, footers, and descriptions.
Implement parameters for dynamic filtering options.
Step 4: Preview Your Report
Before finalizing your report, use the preview feature in Report Builder to ensure everything appears as intended. Check for formatting issues or any necessary adjustments.
Step 5: Publish Your Report
Once you’re satisfied with your report design:
Save your report locally.
Publish it directly to the Power BI service by selecting the appropriate workspace.
This step allows you to manage access permissions and share the report with stakeholders seamlessly.
Best Practices for Using Paginated Reports
To maximize the effectiveness of paginated reports within your organization, consider these best practices:
Define Clear Objectives
Before creating a paginated report, define its purpose clearly. Understand what information needs to be conveyed and who the intended audience is. This clarity will guide your design choices.
Optimize Data Queries
Ensure that the queries used to populate your paginated report are optimized for performance. Efficient queries lead to faster loading times and a better user experience.
Maintain Consistent Formatting
Consistency in formatting across all paginated reports enhances professionalism and readability. Use standardized fonts, colors, and layouts that align with your organization’s branding guidelines.
Regularly Review and Update Reports
As business needs evolve, so should your reports. Establish a routine for reviewing and updating paginated reports to ensure they remain relevant and accurate over time.
Common Challenges with Paginated Reports
While implementing paginated reports can significantly enhance your reporting capabilities, challenges may arise:
Complexity in Configuration
Setting up paginated reports can seem complex initially due to their detailed nature.
Solution: Start with simpler projects using smaller datasets before scaling up complexity as you become more comfortable with the tools available.
User Adoption
Users may resist adopting new reporting formats if they are accustomed to traditional dashboards.
Solution: Provide training sessions demonstrating how paginated reports complement existing reporting methods while enhancing detail and structure.
Conclusion
Power BI paginated reports serve as an essential tool for organizations seeking detailed and structured data presentations. With their ability to generate print-ready documents, support dynamic filtering through parameters, and integrate seamlessly into the Power BI ecosystem, they offer significant advantages over traditional reporting methods.
Related to Power BI Tutorials