Reports and Dashboards
Written By: Sajagan Thirugnanam
Last Updated on September 22, 2026
A field parameter lets a report reader choose, from a slicer, which measure or which dimension a visual shows. One chart can switch between Revenue, Margin and Units, or between Region, Product and Customer, without you building a chart for each. You create one in Power BI Desktop under Modeling > New parameter > Fields. No preview setting needs to be turned on.
What a field parameter is
A field parameter is a small calculated table that lists fields from your model. Power BI adds it to the model and creates a slicer for it. When a reader picks a field in the slicer, every visual that uses the parameter swaps in that field.
You can put measures, columns, or both into one parameter. A measure-based parameter goes in a visual's values. A column-based parameter goes on an axis, in rows or in a legend.
How to create a field parameter
In Power BI Desktop, open the Modeling tab and select New parameter > Fields.
Give the parameter a name, for example
Sales Metric.Select the fields to include. Drag them to change the order, and double-click one to change the name the reader sees.
Leave Add slicer to this page checked and select Create.
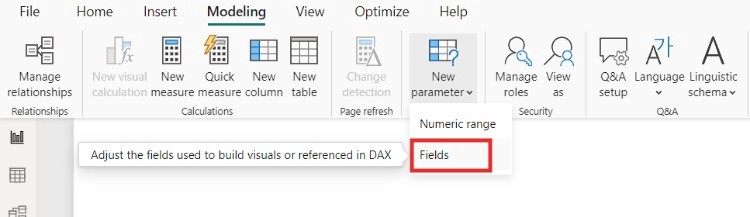
Power BI Desktop > Modeling > New parameter > Fields.
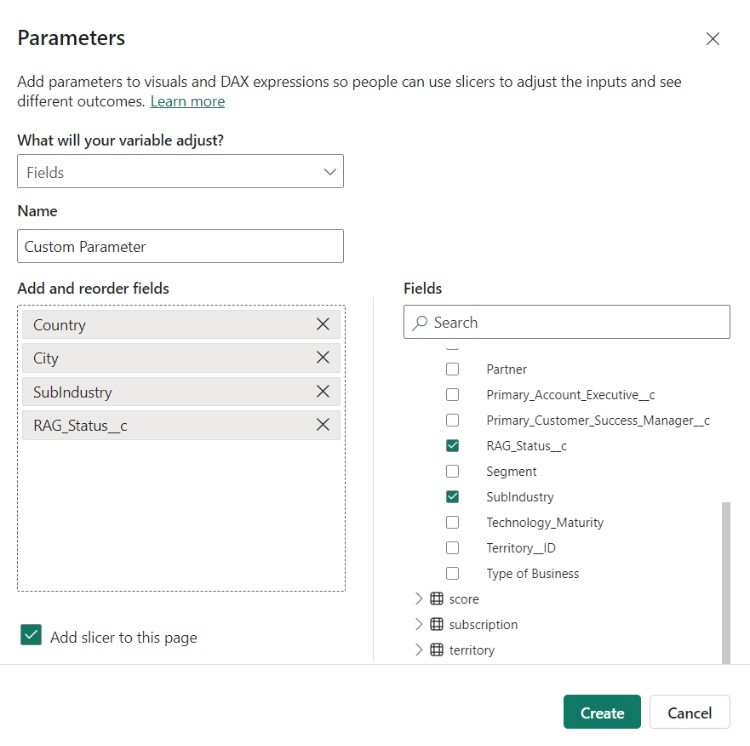
The Parameters dialog. Selected fields appear on the left, in the order the slicer will show them.
Power BI adds a table called Sales Metric to the Data pane and a slicer to the page.
How to use it in a visual
Add a visual, then drag the parameter field, not the individual measures, into the visual's field well:
A parameter of measures goes into Values or Y-axis.
A parameter of columns goes into X-axis, Rows, Legend or similar.
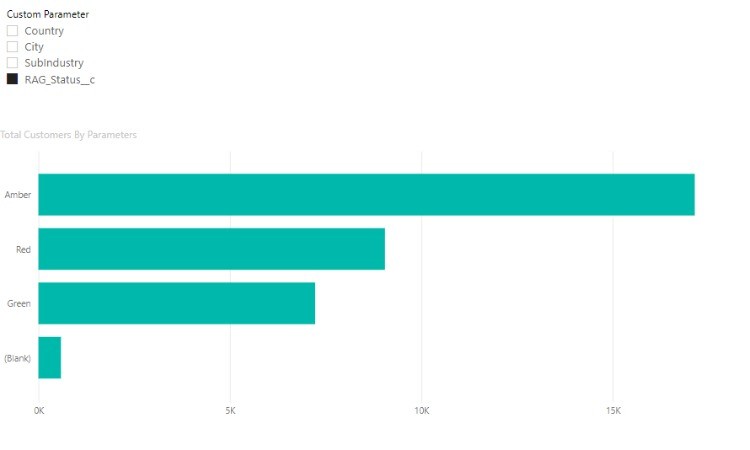
A bar chart bound to the parameter. Selecting RAG_Status__c in the slicer puts that column on the axis.
Select an option in the slicer and the visual changes. If the visual supports several measures and the reader selects several in the slicer, they appear side by side.
The DAX behind it, and how to edit it
Power BI writes the parameter as a DAX table. Each row has a display name, a reference to the field and a sort order:
To add a field later, select the table and edit this expression. Add a comma after the last row, press Shift + Enter for a new line, and add the new row with the next sort number. Microsoft warns against adding extra columns to this table. It is not supported and can give unexpected results.
Two slicer options worth knowing
Show values instead of field names
Right-click a column-based parameter in the Build pane and select Show values of the selected field. The slicer becomes a hierarchy slicer that shows the values inside each field. This is useful for a natural hierarchy such as Year, Month and Day of week in one slicer. It is not available for parameters that contain measures.
Keep a matrix expanded when the field changes
By default, a matrix keeps its expanded hierarchy level when the reader switches fields. You can turn this off under File > Options and settings > Options > Current File > Report settings > Field Parameters > Persist hierarchy level.
When to use field parameters
One chart, several metrics. A finance page that switches between Net Profit, Gross Margin and Operating Expenses in one line chart.
One table, several breakdowns. A sales table that the reader can group by Region, Product Category or Sales Rep.
Fewer bookmarks. Before field parameters, switching views meant one visual per view plus bookmarks and buttons to show and hide them. A parameter does the same with one visual and nothing to maintain.
A field parameter changes which field is shown. It does not filter data. To restrict which rows a visual shows, you need a filter or a slicer on the data itself; see our guide to Power BI filters.
Limitations
From Microsoft's documentation:
No implicit measures. If you want an aggregated column, such as the sum of Quantity, create an explicit DAX measure for it first. Our DAX guide covers writing measures.
No "none" option. Selecting nothing in the slicer is the same as selecting all fields.
No AI visuals or Q&A. They do not work with field parameters.
No drill-through or tooltip links. You cannot use a field parameter as the linked field of a drill-through or tooltip page. Link the individual fields instead.
Live connections need a local model. You cannot create a parameter on a live connection to a Power BI semantic model or Analysis Services unless you add a local model with DirectQuery.
Date hierarchies drop off. A date column from auto date/time loses its date hierarchy inside a parameter. Add Year, Quarter and Month as separate fields if you need them.
FAQs
What is the difference between field parameters and bookmarks in Power BI?
Bookmarks save a state of the page, such as which visuals are visible, and you switch states with buttons. Field parameters change the field inside one visual. For switching measures or dimensions, field parameters need less maintenance, because there is one visual instead of several hidden ones. Bookmarks still suit changes that are not about fields, such as switching between a chart and a table.
What are the limitations of field parameters in Power BI?
Readers cannot select "none", implicit measures are not allowed, AI visuals and Q&A are not supported, parameters cannot be drill-through or tooltip link fields, and live connections need a local model. See the full list above.
Do I need to enable field parameters in preview features?
No. Field parameters are a standard feature. Open Modeling > New parameter > Fields.
Sources
Use field parameters in Power BI reports - Microsoft Learn
Related to Reports and Dashboards