DAX and Data Modeling
Written By: Sajagan Thirugnanam
Last Updated on September 23, 2026
Build a date table by generating one row per day with DAX or with an M query in Power Query, then add year, month, quarter and fiscal columns, set sort-by-column on the text fields, and mark the table as your model's official date table. This post builds one complete table end to end, in both DAX and Power Query. You finish with a table that is ready for time intelligence functions. For an overview of every method, including importing a prebuilt calendar, see our guide to creating date tables in Power BI.
What the table needs before it works
Power BI's time intelligence functions, such as TOTALYTD and SAMEPERIODLASTYEAR, only work correctly against a table that meets three conditions:
One row per calendar day, with no gaps and no duplicates.
A date column with a real
datedata type, not text or a datetime with a time part.Full years in range, since a partial year breaks year-over-year comparisons at the edges.
A calculated table or an M query that lists every day between two dates meets all three automatically, which is why both methods below start there.
Method 1: build it with DAX
Open the Modeling tab and select New table. Enter this formula:
CALENDAR produces the raw list of dates. ADDCOLUMNS adds every attribute you will filter or group by, computed once when the table refreshes rather than at query time. Adjust the two dates in CALENDAR to cover your actual data range, with a little headroom on each end.
The fiscal columns assume the fiscal year starts in the fourth calendar month, and label each fiscal year by the calendar year it ends in. The + 8 shifts months so the fourth month becomes fiscal month 1. For a fiscal year starting in month n, use + (12 - n) in the fiscal month and quarter formulas and >= n in the fiscal year formula. Adding instead of subtracting keeps the number positive. This matters in M: Number.Mod returns a negative result for a negative input, where DAX's MOD does not.
Method 2: build it with Power Query
In Power BI Desktop, select Transform data to open Power Query Editor, then Home > New Source > Blank Query. Open the Advanced Editor and paste:
Rename the query to Date, then select Close & Apply. Each Table.AddColumn step builds on the last, so the final table carries every column the DAX version does.
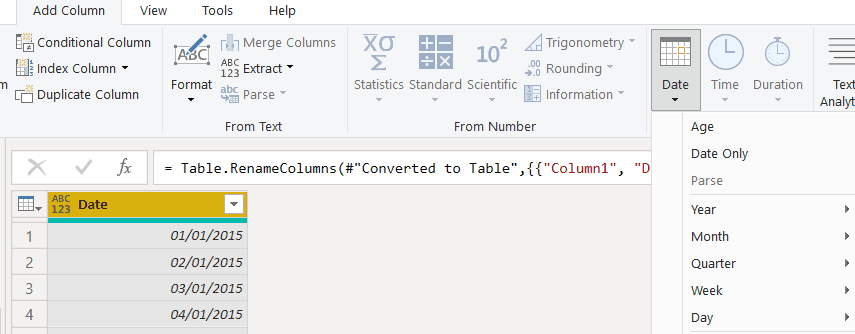
The Add Column > Date menu in Power Query, a fast way to add date attributes if you build the base date list by hand.
Set sort-by-column
FORMAT and Date.MonthName return text, so Month Name sorts in text order by default, not calendar order, and Day Name does the same. Fix both:
Select the Month Name column. On the Column tools tab, select Sort by column and choose Month Number.
Select the Day Name column, select Sort by column, and choose Day Of Week Number.
Slicers and axes built from either column now sort in calendar order instead of alphabetically.
Mark the table as a date table
Right-click the table in the Fields pane and select Mark as date table, then choose the Date column. Power BI then validates that the column meets the conditions above, and uses this table for time intelligence instead of any automatic date table.
Turn off Auto date/time
Auto date/time creates a hidden calendar table behind every date or datetime column in the model. With a real date table in place, that hidden table is redundant and adds size for nothing.
Go to File > Options and settings > Options, select the Current File tab, then Data Load, and clear Auto date/time for this file.
Under the Global tab, select Data Load and clear Auto date/time for new files so future files start without it.
Turning it off for the current file deletes the hidden tables. Any visual or measure that used an automatic date hierarchy stops working, so rebuild those on your Date table's columns first, then turn the setting off.
With the table marked and Auto date/time off, it is ready for time intelligence measures such as year-to-date and prior-year comparisons. See our guide to time intelligence in Power BI and how to create YTD calculations for the DAX that runs against this table.
Sources
Date tables in Power BI Desktop - Microsoft Learn
Auto date/time in Power BI Desktop - Microsoft Learn
Related to DAX and Data Modeling