DAX and Data Modeling
Written By: Sajagan Thirugnanam
Last Updated on September 23, 2026
A measures table is an empty table that exists only to hold your DAX measures, so they sit in one place in the Data pane instead of being spread across every fact and dimension table. You create it in Power BI Desktop with Home > Enter data, add a measure to it, and then delete the placeholder column. Power BI then shows the table with a calculator icon at the top of the Data pane.
If you are new to writing measures, start with how the CALCULATE function works and the difference between measures and calculated columns.
What Exactly Is A Measures Table In Power BI?
A measures table is a table with no data of its own. It stores the measures you write while building a report. A measure does not need to live in the table whose columns it uses. A measure in the measures table can still sum a column in the Sales table.
Without one, measures end up in whichever table was selected when each was created. In a larger model, the Data pane looks like this:
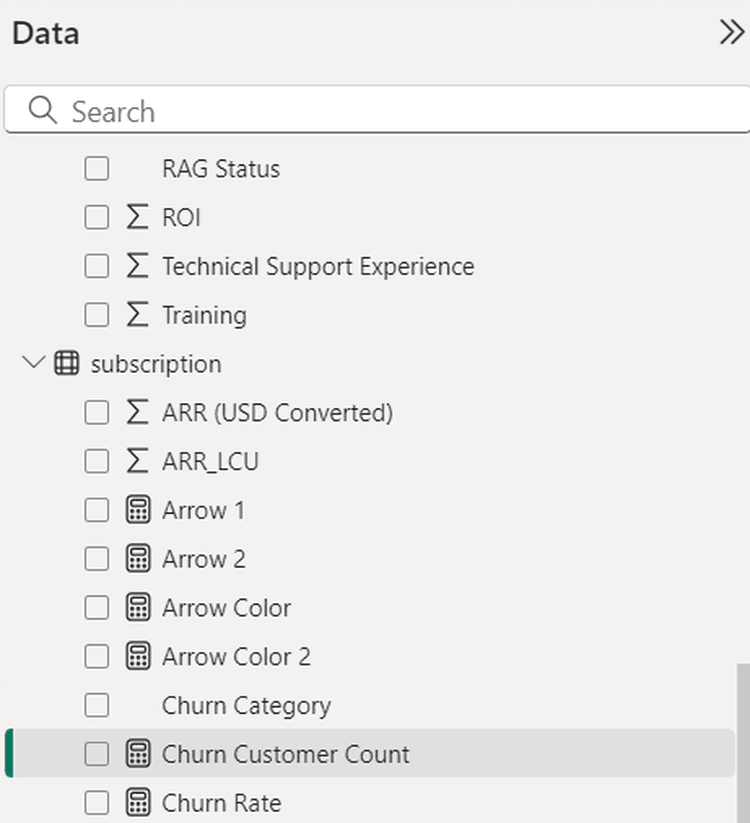
The Data pane before a measures table: measures (calculator icon) mixed in with columns in the subscription table.
Finding the right measure then means opening each table and scrolling. Moving every measure into one table named, for example, Measures Table fixes that.
How To Create A Measures Table
In Power BI Desktop, select Enter data on the Home ribbon. This opens the Create Table dialog.
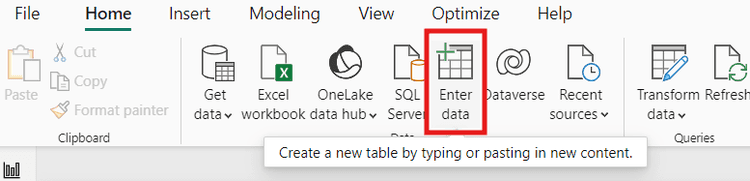
Home > Enter data.
In Name, type
Measures Tableor another name you prefer. Leave the emptyColumn1as it is and select Load.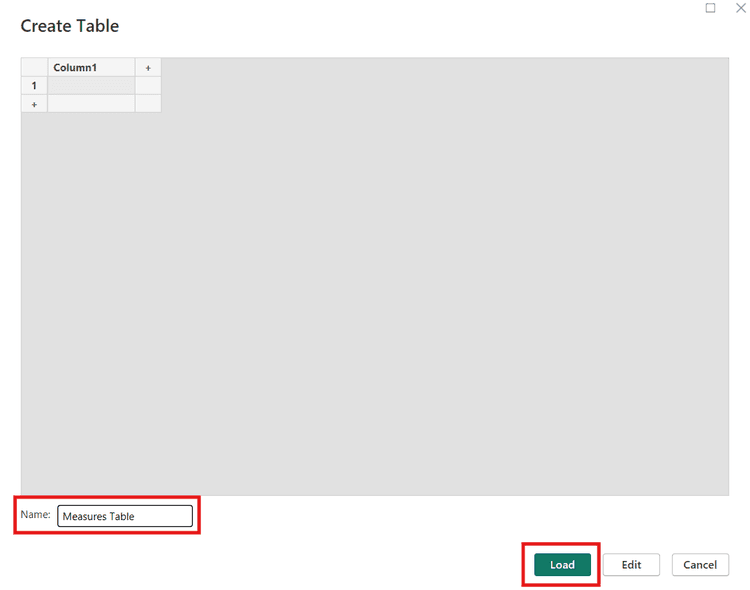
The Create Table dialog. Only the name matters; the empty column is removed later.
In the Data pane, right-click the new table and select New measure.
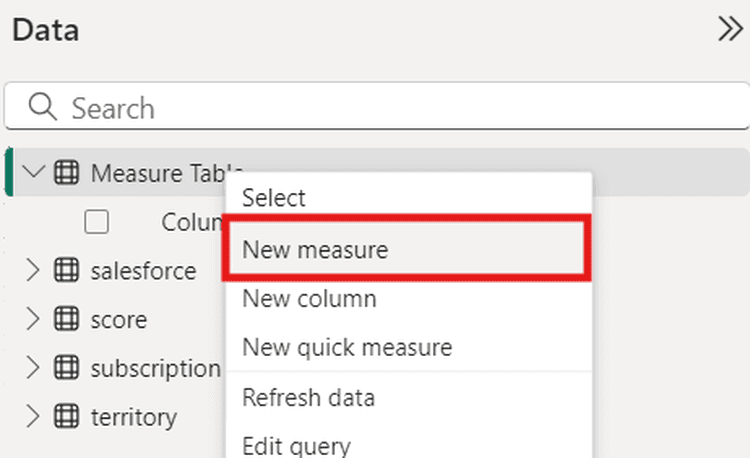
Right-click the table in the Data pane > New measure.
Write the measure in the formula bar. This example sums a health score column from a table named
score:Delete
Column1. Right-click it in the Data pane and select Delete from model. Once the table holds only measures, Power BI shows it with a calculator icon and moves it to the top of the Data pane.
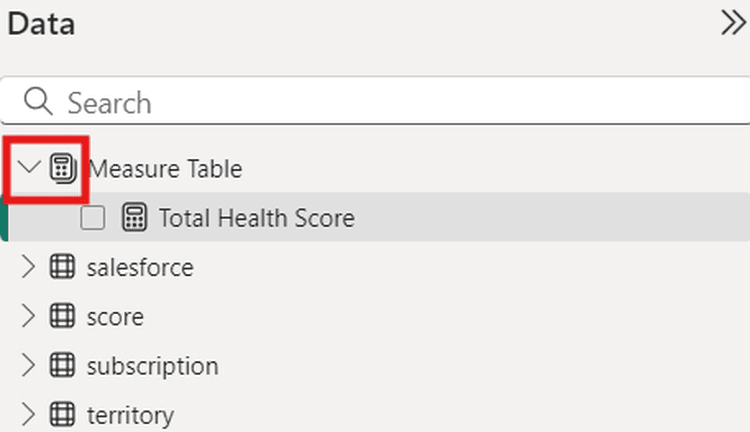
After Column1 is deleted, the table shows the measures table icon and sits above the other tables.
Add every new measure to this table.
Move existing measures into the measures table
You do not need to re-create measures that already exist elsewhere. Select a measure in the Data pane and change its Home table to Measures Table. You can do this in the Measure tools ribbon or in the Properties pane in Model view. The DAX does not change, and visuals that use the measure keep working.
How To Create Folders In The Measures Table
Display folders group measures inside the table, the same way folders group files on a computer. For example, you can keep totals in one folder and averages in another.
Open Model view from the left side of Power BI Desktop.
Select the measure you want to put in a folder.
In the Properties pane, type a folder name in Display folder, for example
Total Measures.
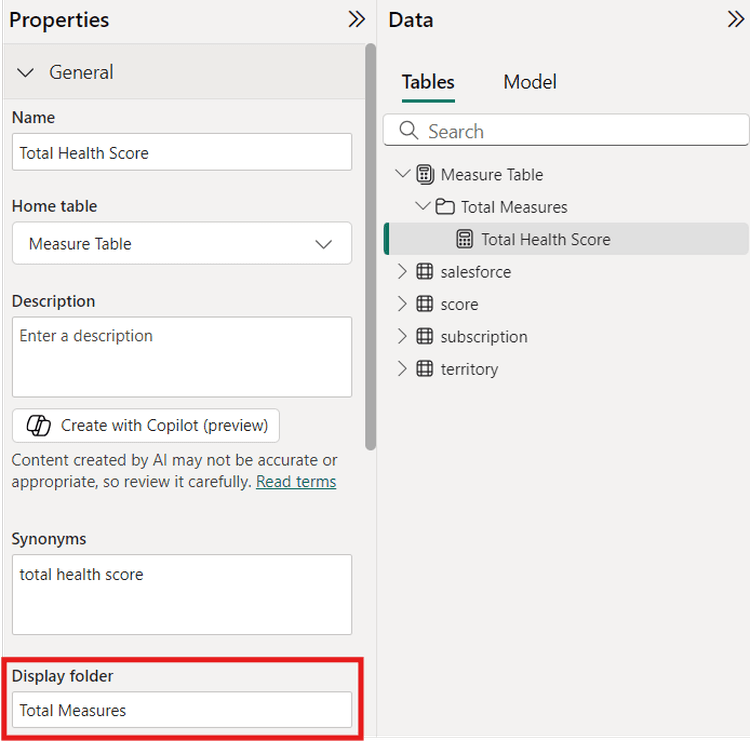
Model view > Properties > Display folder. The folder appears in the Data pane as soon as the name is entered.
Type the same folder name on other measures to add them to it. You can create as many folders as you need.
In Closing
A measures table is worth adding to any model with more than a handful of measures. It costs nothing, needs no relationships, and makes the model easier for the next person to work with. Once the table exists, give every new measure a clear name and a display folder. The DAX variables guide covers how to keep the measures themselves readable, and the data modeling best practices post covers the rest of the model.
FAQs
Can I create more than one measures table in a Power BI data model?
Yes. You can create as many as you like with the same steps. Most models do not need more than one, because display folders already group measures by topic. A second measures table is useful when two very different audiences use the same model, for example finance measures and operations measures.
Do I need to create a relationship for my measures table with any of the other fact or dimension tables in my data model?
No. A measure can reference columns and other measures from any table in the model, whichever table it is stored in. The measures table has no rows to relate, so it needs no relationships.
Sources
Measures in Power BI Desktop - Microsoft Learn
Related to DAX and Data Modeling