Business Intelligence
Written By: Sajagan Thirugnanam and Austin Levine
Last Updated on November 1, 2024
Introduction
Business Intelligence (BI) reporting is a crucial aspect of data analytics that enables organizations to transform raw data into actionable insights. By effectively analyzing and presenting data, businesses can make informed decisions that drive growth and improve operational efficiency.
This complete guide will explore the fundamentals of BI reporting, its importance, key components, types of reports, best practices, and steps to create effective BI reports.
What Is Business Intelligence Reporting?

Source: The BHW Group
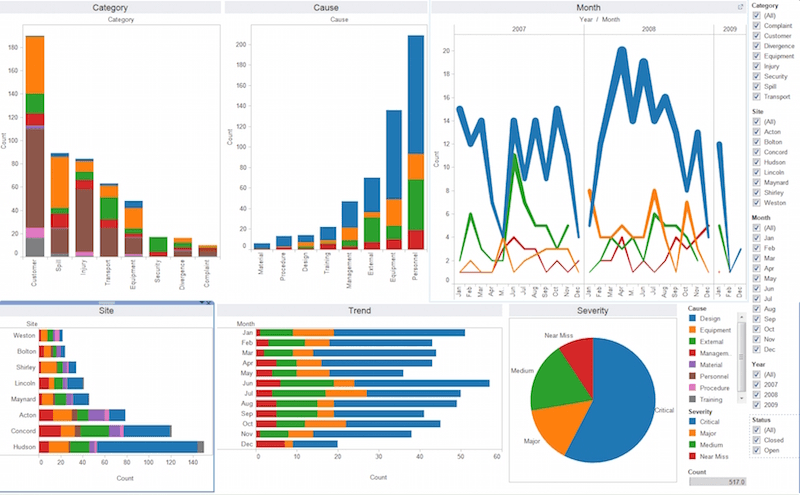
Business Intelligence reporting involves the systematic collection, processing, and presentation of data to provide insights into business performance. It utilizes various BI tools to visualize data and generate reports that help stakeholders understand trends, measure performance against goals, and identify areas for improvement. These reports can take many forms, including dashboards, scorecards, and detailed analytical reports.
Importance of Data Reporting
Data reporting is essential for several reasons:
Informed Decision-Making: BI reports provide the necessary insights that help leaders make strategic decisions based on factual data rather than intuition.
Performance Tracking: Regularly generated reports allow organizations to monitor their performance against established KPIs and objectives.
Trend Identification: By analyzing historical data, businesses can identify patterns and trends that inform future strategies.
Accountability: Reports create transparency within teams by clearly outlining performance metrics and responsibilities.
Key Components of BI Reporting
Effective BI reporting consists of several key components:
Data Collection
The foundation of any BI report is accurate data collection. This involves gathering data from various sources such as databases, CRM systems, marketing platforms, and more. Ensuring the quality and relevance of collected data is crucial for reliable reporting.
Data Processing and Transformation
Once collected, data must be processed to eliminate inconsistencies and errors. This step includes cleaning the data, transforming it into a usable format, and organizing it for analysis.
Data Analysis
Data analysis involves examining the processed data to uncover insights. This may include statistical analysis, trend analysis, or comparative analysis against benchmarks or historical performance.
Data Visualization
Visual representation of data is vital for effective communication. Charts, graphs, and dashboards help stakeholders quickly grasp complex information and identify key trends at a glance.
Insights and Recommendations
A comprehensive BI report should not only present data but also provide actionable insights based on the analysis. Recommendations should guide decision-makers on potential actions to take based on the findings.
Types of Business Intelligence Reports

Source: Trevor.io
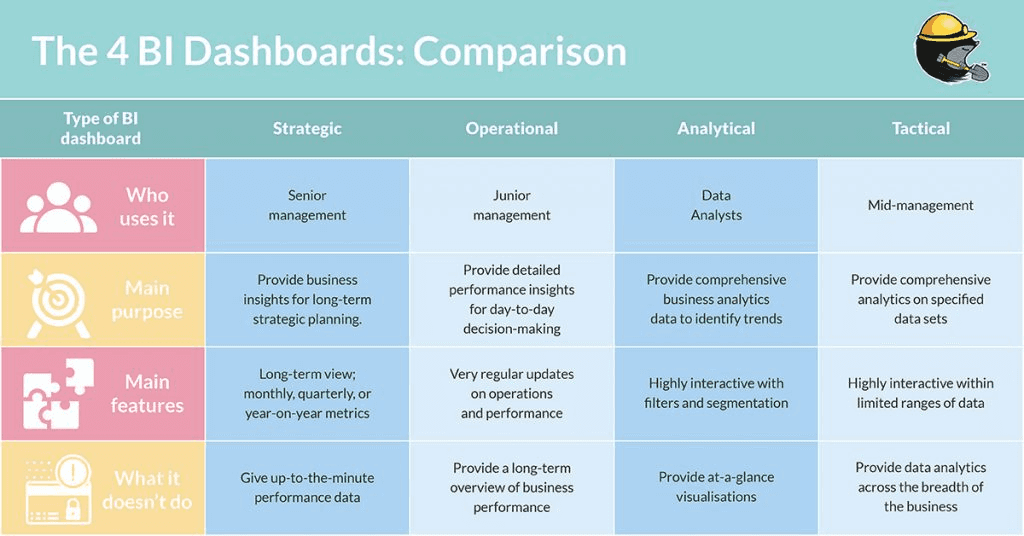
Different types of BI reports serve various purposes within an organization:
Operational Reports
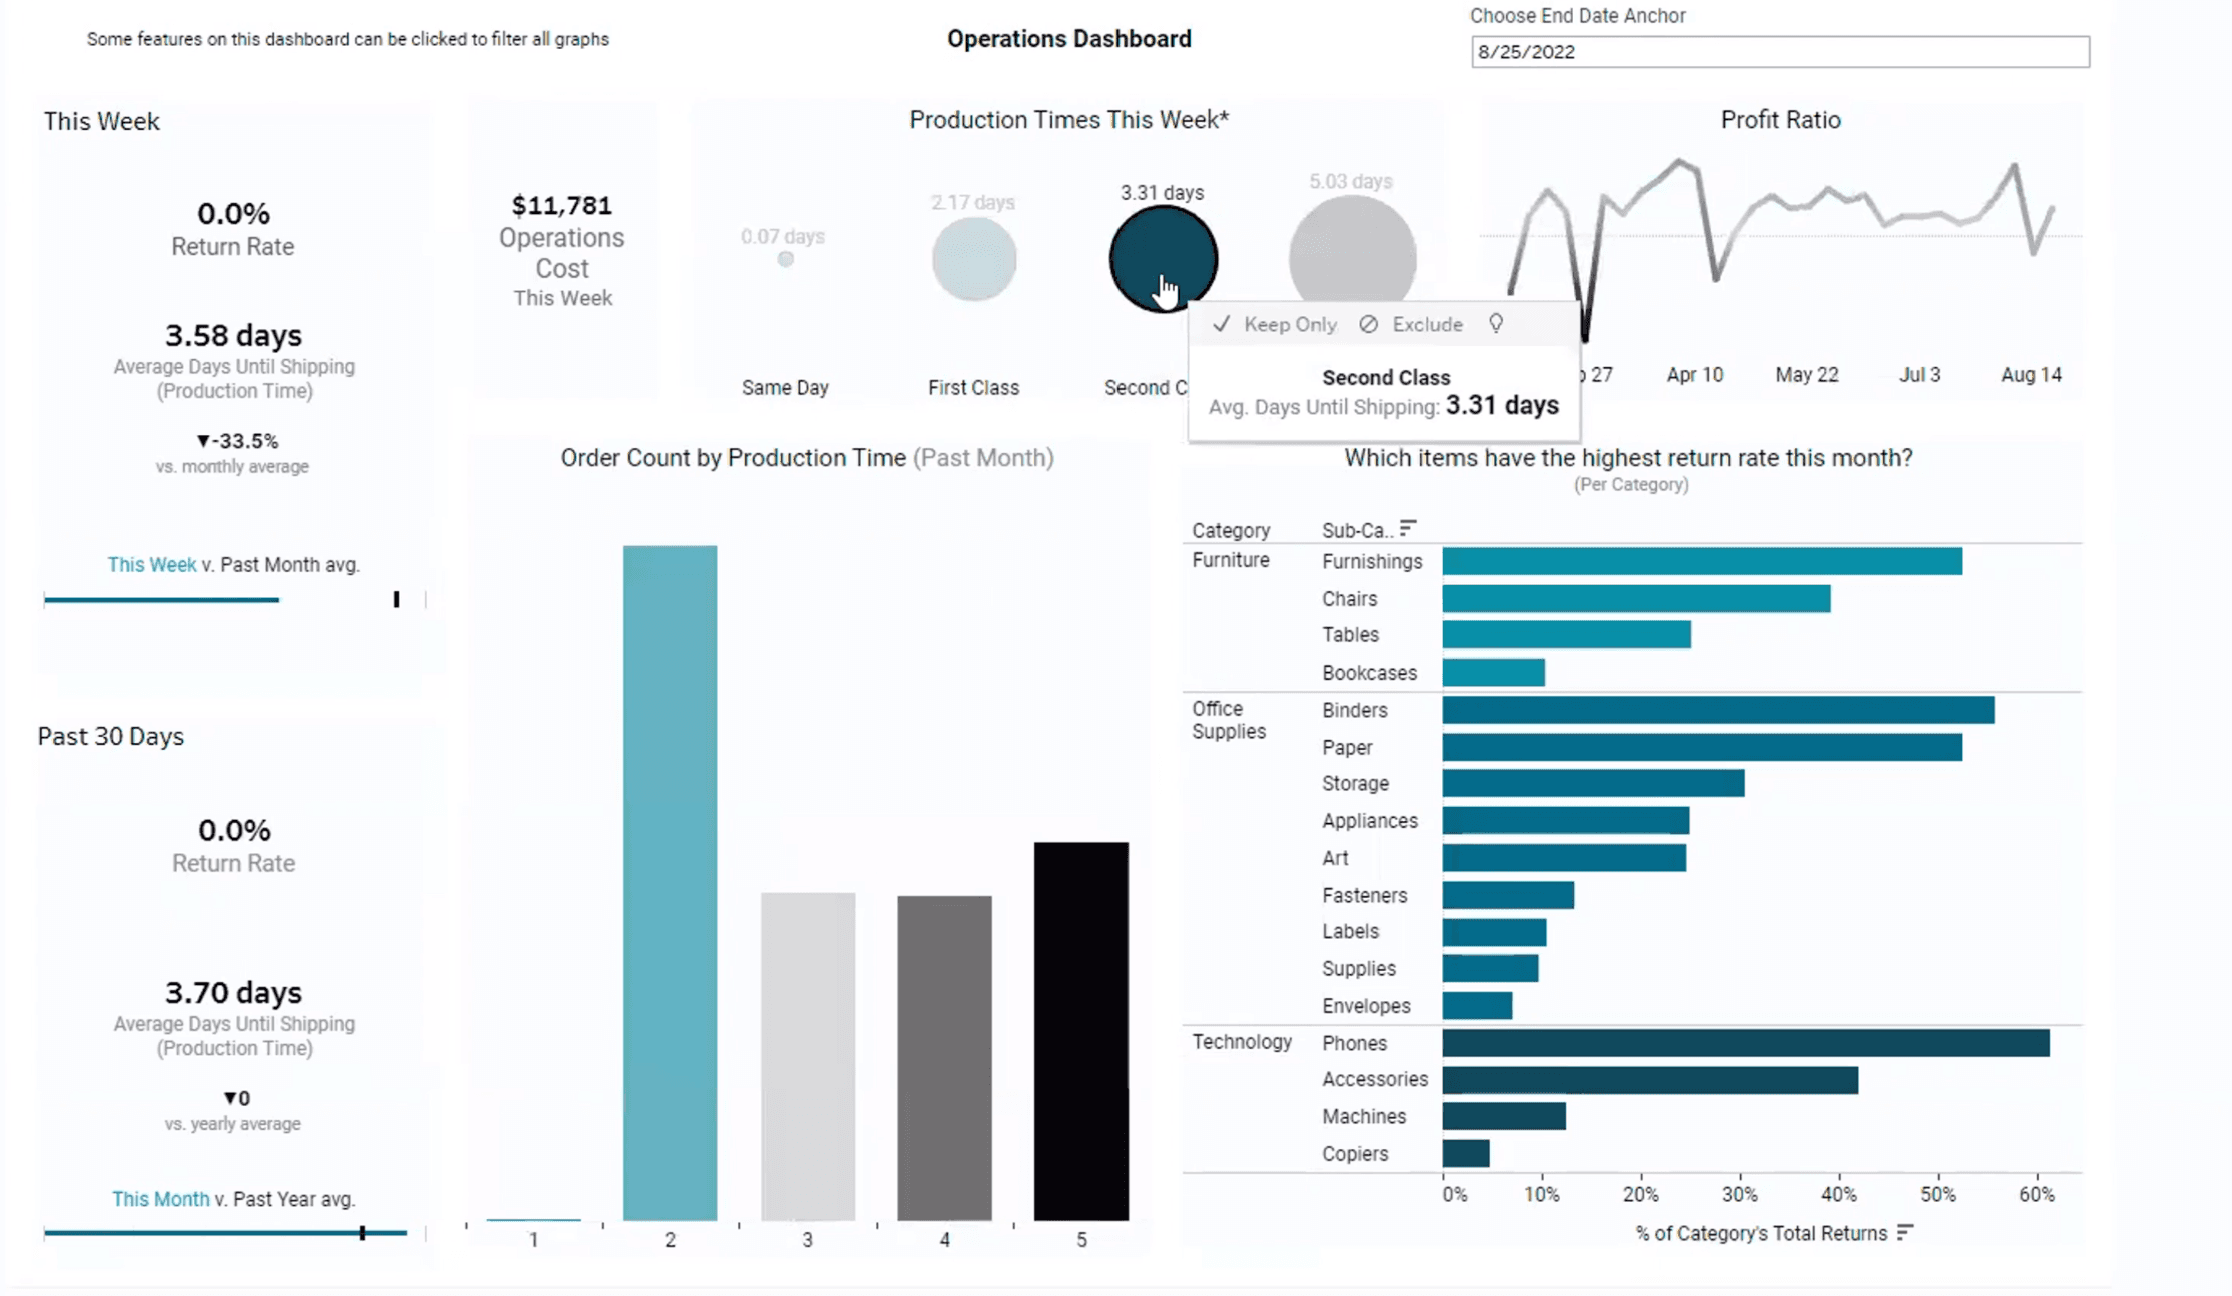
Operational reports focus on the day-to-day operations of a business. They provide insights into metrics such as sales performance, production efficiency, or customer service response times.
Strategic Reports
Strategic reports are high-level documents that assess overall business performance against long-term goals. They typically include analyses of market trends and competitive positioning.
Tactical Reports
Tactical reports are used to track progress on specific initiatives or projects. They help teams monitor short-term objectives that contribute to broader strategic goals.
Ad-Hoc Reports
Ad-hoc reports are created on an as-needed basis to address specific questions or issues that arise within the organization. These reports are often more flexible in nature and can be tailored to meet immediate needs.
Dashboards and Scorecards
Dashboards provide real-time visualizations of key metrics across various business areas. Scorecards summarize performance against strategic objectives using a balanced scorecard approach.
Benefits of Business Intelligence Reporting

Source: Zuar
The benefits of effective BI reporting include:
Enhanced Decision-Making: Access to timely and relevant information allows leaders to make informed decisions swiftly.
Improved Operational Efficiency: By identifying inefficiencies through reporting, organizations can streamline processes.
Better Resource Allocation: Insights from BI reports help prioritize resources toward high-impact areas.
Increased Accountability: Regular reporting fosters a culture of accountability among teams by tracking performance against defined metrics.
Essential Features of Effective BI Reporting Tools
When selecting BI reporting tools, consider the following essential features:
Data Integration
Effective BI tools should seamlessly integrate with various data sources to provide comprehensive insights without manual intervention.
User-Friendly Interface
A user-friendly interface enables non-technical users to generate reports easily without extensive training.
Customization
Customization options allow users to tailor reports according to their specific needs or preferences.
Real-Time Analytics
Real-time analytics capabilities ensure that stakeholders have access to the most current data for timely decision-making.
Collaboration Capabilities
Collaboration features facilitate sharing insights across teams, enhancing communication and alignment within the organization.
Security and Compliance
Robust security measures are essential for protecting sensitive data while ensuring compliance with relevant regulations (e.g., GDPR).
How to Create Effective BI Reports: Step-by-Step
Creating effective BI reports involves several systematic steps:
Step 1: Define Report Objectives
Clearly outline what you want to achieve with the report. Understanding your objectives will guide the selection of relevant metrics.
Step 2: Choose Relevant Metrics and KPIs
Identify which KPIs are most pertinent to your objectives. Ensure they provide meaningful insights into business performance.
Step 3: Gather and Clean Data
Collect data from identified sources and clean it to remove inaccuracies or inconsistencies. This ensures reliable inputs for your report.
Step 4: Select Appropriate Visualizations
Choose visualization formats (e.g., charts, graphs) that best represent your data. Effective visualizations enhance clarity and comprehension.
Step 5: Design the Report Layout
Create a structured layout that highlights key findings prominently while maintaining an intuitive flow for readers.
Step 6: Validate and Test the Report
Review the report for accuracy and coherence before finalizing it. Validation ensures that all information is correct and actionable.
Step 7: Distribute and Monitor
Share the completed report with relevant stakeholders through appropriate channels (e.g., email, dashboards) while monitoring its impact on decision-making processes.
Best Practices for BI Reporting
To maximize the effectiveness of your BI reporting efforts:
Keep It Simple: Avoid cluttering reports with excessive information; focus on key insights.
Ensure Data Accuracy and Consistency: Regularly validate data sources to maintain reliability.
Make Reports Interactive and Customizable: Allow users to explore data dynamically based on their interests.
Focus on Actionable Insights: Highlight recommendations alongside findings for clear next steps.
Regularly Update Reports: Schedule updates to keep information current and relevant.
Incorporate Predictive Analytics Where Possible: Use predictive models to forecast future trends based on historical data.
BI Reporting Tools: Popular Options and Key Features
Several popular BI reporting tools offer unique features:
Tableau: Known for its powerful visualization capabilities; enables users to create interactive dashboards easily.
Power BI: A Microsoft product that integrates well with other Microsoft tools; offers robust analytics features.
Looker: Focuses on providing real-time insights through an intuitive interface; supports custom applications.
QlikView/Qlik Sense: Provides associative analytics capabilities; allows users to explore data freely without predefined queries.
These tools empower organizations to create insightful reports tailored to their specific needs.
Related to Business Intelligence