Business Intelligence
Written By: Sajagan Thirugnanam and Austin Levine
Last Updated on July 7, 2025
If you’re operating a business in 2025, chances are you’re generating million rows of data on a daily basis ranging from sales numbers, customer analysis and marketing results — but how do you make sense of it all?
That’s where business intelligence (BI) tools like Looker and Power BI come in. These platforms turn your raw data into meaningful information through clear, interactive charts, dashboards, and reports that help you make smarter, more informed decisions.
But which one is right for you, especially if you're not a data expert?
Let’s break it down in simple terms.
Power BI Overview: Key Features for Business Users
Power BI is a Microsoft product aiming to provide analytical solutions to businesses and data professionals. It’s one of the most popular options because it’s easy to use, affordable, and works well with familiar Microsoft products like Excel and Teams.
Power BI provides a complete data visualization solution starting from data prep and transformation to creating complex calculations and reports. Here are some of Power BI’s features:
Seamless integration with Microsoft 365, Azure, and Excel
Desktop, cloud, and mobile versions
Drag-and-drop dashboard creation
AI-powered analytics and features
Paid version for small teams
Power BI is a powerful business intelligence tool but there are other such BI tool alternatives which provide similar solutions with certain added perks and quirks. Let’s take a look at one such tool and learn more about it.
Looker Studio Overview: Simple BI Tool for Google Users
Looker Studio is a Power BI alternative owned by Google to provide a visualization solution to users of the Google Cloud Platform and other users. Looker Studio is relatively easier to use compared to other business intelligence tools with fast paced visual options without the need to have prior visualization experience.
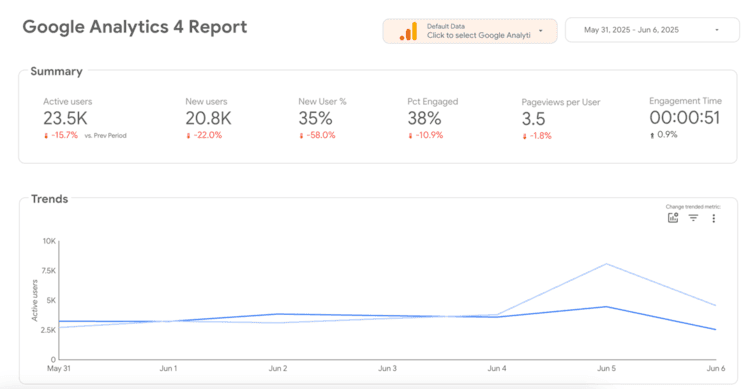
Looker Studio report based on Google Analytics data
From our experience, customizing your reports in Looker Studio is easier and more intuitive. This is because it has a simpler layout and fewer options than Power BI. It’s faster to find what you need. For example, if you want to change the font or chart type, you can easily do so from the right side design panel of the interface.
Looker Studio vs Power BI: Which BI Tool Is Right for You?
Now that you have a basic understanding of Power BI and Google Looker Studio, you must be wondering how to pick between these two business intelligence tools.
Well, there is not one right answer. Choosing a BI tool depends on your business needs, existing system in use and expertise of your data team.
The number one thing you should consider while picking between Microsoft’s Power BI and Google Looker Studio is whether your team already uses Microsoft services or Google Cloud Platform. As you may already guess, Power BI works seamlessly with Microsoft services such as Teams and Outlook. This helps in sharing and collaborating while creating reports in Power BI.
Vice versa, Google Looker Studio is great for teams using GCP as their main system. Teams depending on Google Analytics data prefer using Looker Studio to create fast and intuitive reports through Looker due to its compatibility.
Here is a table comparing between the two BI tools: Power BI vs Looker Studio.
Feature | Power BI | Looker Studio |
Ease of use | More complex for beginners, has a learning curve | Easier to use interface with simple navigation |
Customization | More extensive visual options and templates which are great for more in-depth customization | Basic charts and graphs for beginners |
Integration | Wide range of data sources including Snowflake, Salesforce, Excel, Google Analytics etc. | Supports over a thousand data sources. Seamless and fast integration with Big Query and GCP |
Data transformation | Advanced features such as DAX and star schema data modeling | Basic calculations, formulas and data joining |
Cost | Has both free and paid versions. Paid plans start from $10/user/month | Also has free version and is included with Google Cloud Platform subscription |
Best use case | Advanced data analysis, complex reporting and technical users | Simple marketing reports catered towards non-technical users |
Our Recommendation: Power BI vs Google Looker Studio
For most small and mid-sized businesses, or if you’re just starting with BI tools and already using Google Cloud Platform and Google Analytics, Looker Studio is likely the better option. It’s easier to use, cheaper, and gives you fast access to insights without hiring a data team.
However, if you want a more feature rich dashboard with more complex visuals and data prep feature then Microsoft’s Power BI might be a better pick for your team.
But keep in mind, you can’t go wrong with either. They are both great options with amazing data visualization features.
We hope this article helps you choose between the two business intelligence tools. Feel free to visit CaseWhen’s site for more in-depth information on such topics.
FAQs
Can I use Power BI without any prior experience?
Yes! Most people can build simple dashboards in Power BI within a few hours. It’s very user-friendly. For an introduction to Power BI and other relevant topics, check out our blog section.
Do I need to know coding to use Google Looker Studio?
Not really. Both Power BI and Looker use their own language which is easy to pick up as you go. No need to know coding to begin creating simple reports using these BI tools.
Does Power BI work with Excel?
Yes it does. It’s built to work seamlessly with Excel and other Microsoft tools. In fact, Power BI works similarly to Excel and knowing Excel can be a great place to start for Power BI.
Related to Business Intelligence