Business Intelligence
Written By: Sajagan Thirugnanam and Austin Levine
Last Updated on November 1, 2024
Key Performance Indicator (KPI) reports are essential tools for organizations aiming to measure progress toward their strategic goals. These reports provide a clear and concise way to visualize performance metrics, enabling decision-makers to assess the effectiveness of their strategies and make informed adjustments.
This blog post will explore the definition of KPI reports, their benefits, types, key components, and best practices for creating effective reports that drive business success.
What is a KPI Report?

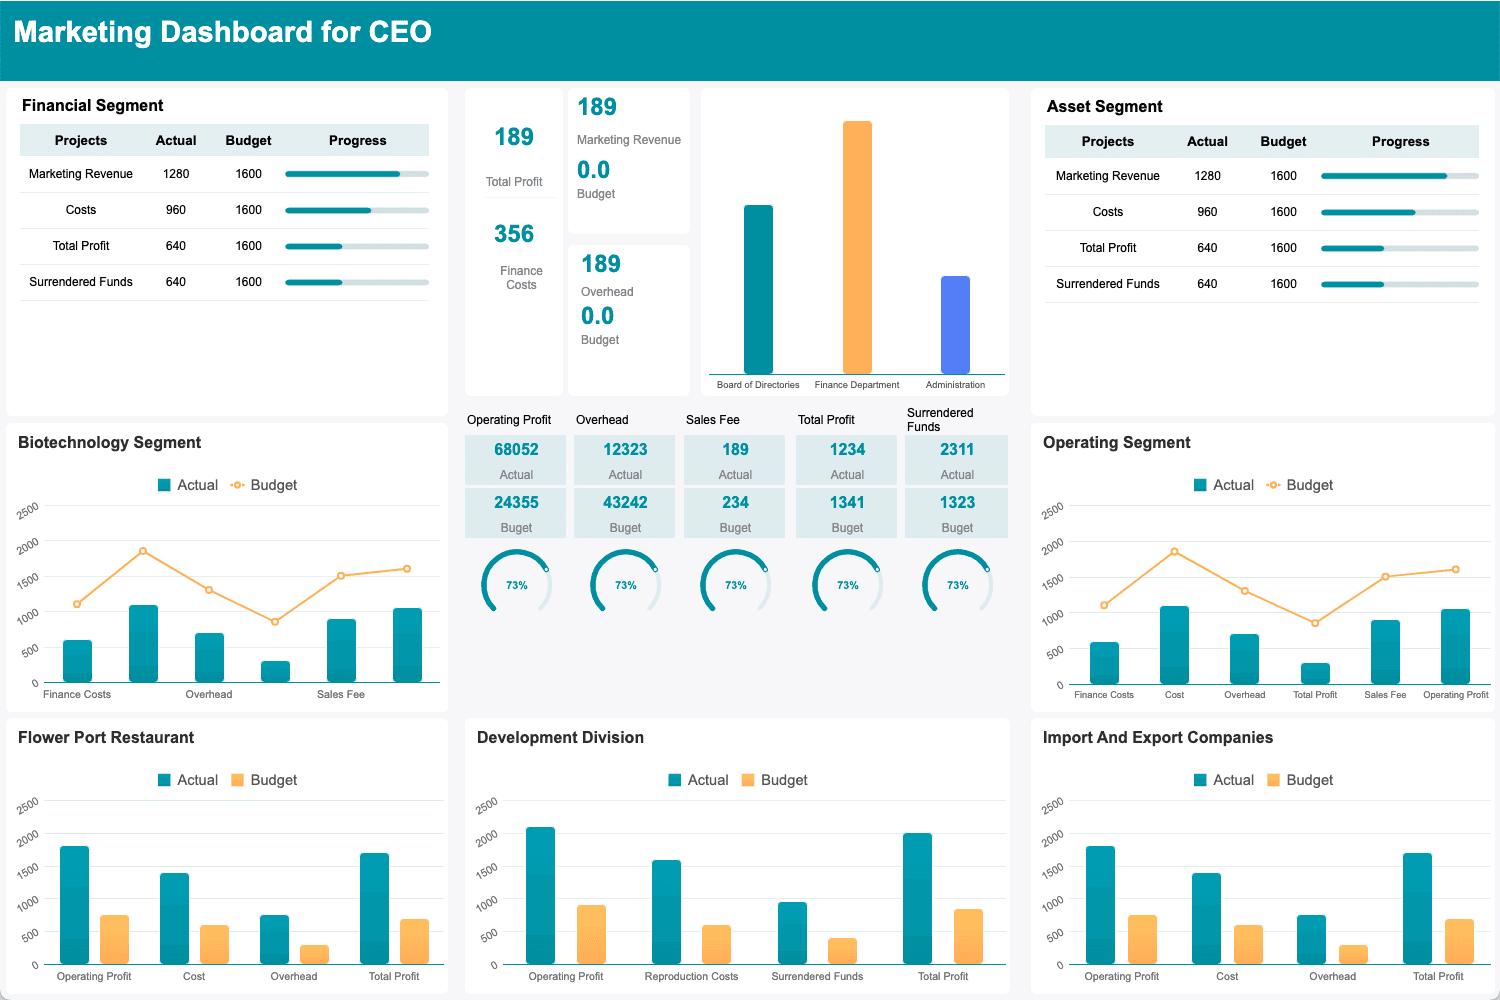
Source: Finereport.com
A KPI report is a management tool that presents key performance indicators in a structured format, allowing organizations to track and analyze quantifiable metrics relevant to their objectives.
These reports typically include visual elements such as charts and graphs, making it easier for stakeholders to interpret data at a glance. KPI reports can be generated on various timeframes—daily, weekly, monthly, or quarterly—depending on the organization's needs and the nature of the metrics being tracked.
Key Benefits of KPI Reports for Business Success
KPI reports offer numerous advantages that contribute to overall business success:
Enhanced Decision-Making: By providing clear insights into performance metrics, KPI reports enable leaders to make data-driven decisions that align with organizational goals.
Increased Accountability: Regularly reviewing KPI reports fosters a culture of accountability among teams, as individuals can see how their contributions impact overall performance.
Improved Performance Tracking: KPI reports facilitate ongoing monitoring of progress towards goals, allowing organizations to identify trends and make timely adjustments.
Alignment with Strategic Goals: These reports help ensure that all departments are aligned with the organization’s strategic objectives by tracking relevant KPIs.
Different Types of KPI Reports
KPI reports can be categorized into several types based on their purpose and focus:
Strategic KPI Reports
Strategic KPI reports provide an overview of an organization’s performance against long-term goals. They typically include high-level metrics that reflect the overall health of the business, such as revenue growth, market share, and customer satisfaction scores.
Operational KPI Reports
Operational KPI reports focus on day-to-day activities within an organization. They provide insights into metrics that affect daily operations, such as production efficiency, sales volume, and customer service response times.
Analytical KPI Reports
Analytical KPI reports delve deeper into the data behind the KPIs. They often include trend analysis and comparative data to help identify patterns and root causes of performance fluctuations.
Tactical KPI Reports
Tactical KPI reports are used to track short-term objectives and initiatives. They help teams monitor progress on specific projects or campaigns, ensuring that tactical efforts align with broader strategic goals.
Key Components of an Effective KPI Report
To create impactful KPI reports, several key components should be included:
Data Visualization
Effective data visualization is crucial for communicating insights clearly. Use graphs, charts, and dashboards to present data in an easily digestible format. This helps stakeholders quickly grasp complex information.
Benchmarking and Targets

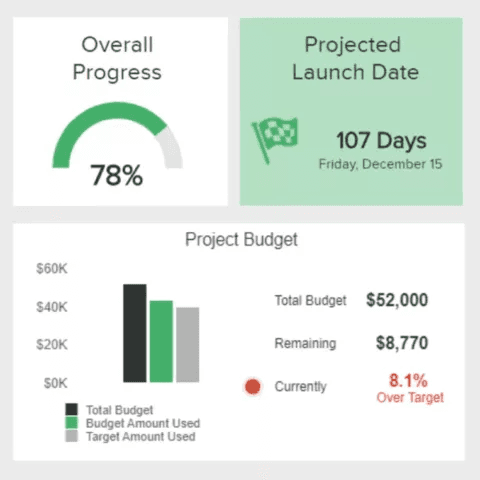
Source: RIB Software
Including benchmarks and targets in your KPI report provides context for performance evaluation. This allows stakeholders to see how current results compare against historical data or industry standards.
Automated Data Updates
Automating data updates ensures that your KPI reports reflect real-time information. This reduces manual effort and minimizes errors associated with outdated data.
Actionable Insights
An effective KPI report should not only present data but also provide actionable insights. Include analysis that explains what the data means for the business and recommend next steps based on findings.
How to Create an Effective KPI Report: Step-by-Step Guide
Creating a comprehensive KPI report involves several steps:
Step 1: Identify Business Objectives
Start by clearly defining your business objectives. Understanding what you want to achieve will guide the selection of relevant KPIs.
Step 2: Select Relevant KPIs
Choose KPIs that directly align with your business objectives. Ensure they are measurable and provide insight into performance.
Step 3: Gather Data and Set Benchmarks
Collect data from reliable sources and establish benchmarks for each KPI. This provides a reference point for evaluating performance over time.
Step 4: Design the Report Layout
Create a clear layout for your report that highlights key metrics prominently. Use consistent formatting to enhance readability.
Step 5: Automate and Schedule Updates
Implement automation tools to regularly update your report with fresh data. Schedule updates based on reporting frequency (e.g., weekly or monthly).
Step 6: Interpret Data and Provide Insights
Analyze the data presented in your report and offer insights that explain trends or anomalies. Highlight areas for improvement or success stories.
Best Practices for KPI Reporting
To maximize the effectiveness of your KPI reporting process, consider these best practices:
Keep It Simple and Focused
Avoid cluttering your report with too many KPIs. Focus on a select few that are most relevant to your objectives.
Use Consistent Formats and Visualizations
Maintain consistency in formatting and visualizations across all reports. This helps stakeholders quickly understand the information presented.
Regularly Update and Review KPIs
Schedule regular reviews of your KPIs to ensure they remain relevant as business priorities evolve. Update targets as necessary based on changing conditions.
Enable Accessibility Across Teams
Ensure that KPI reports are accessible to all relevant stakeholders within the organization. This promotes transparency and encourages collaboration.
Provide Context for KPIs
Always accompany KPIs with context that explains their significance. This helps stakeholders understand how metrics relate to broader business objectives.
Examples of Common KPI Reports by Department
Different departments utilize specific KPIs tailored to their functions:
Sales KPI Report Example
Total sales revenue
Sales growth rate
Average deal size
Sales conversion rate
Customer acquisition cost (CAC)
Marketing KPI Report Example
Website traffic
Conversion rates
Cost per acquisition (CPA)
Return on marketing investment (ROMI)
Social media engagement rates
Finance KPI Report Example
Revenue growth rate
Gross profit margin
Operating cash flow
Return on investment (ROI)
Debt-to-equity ratio
Customer Service KPI Report Example
Average response time
Customer satisfaction score (CSAT)
First contact resolution rate
Net promoter score (NPS)
Ticket resolution time
Human Resources KPI Report Example
Employee turnover rate
Time-to-hire
Employee satisfaction score
Training completion rates
Revenue per employee
How to Measure the Effectiveness of Your KPI Reporting Process
To gauge how well your reporting process is performing:
Feedback from Stakeholders
Regularly solicit feedback from users of the reports regarding clarity, usefulness, and areas for improvement.
Improvement in Decision-Making
Assess whether decisions made based on the insights from your KPIs have led to positive outcomes or improvements within the organization.
Consistency and Accuracy of Data
Monitor how consistently accurate data is presented in your reports over time; discrepancies can undermine trust in reporting processes.
Alignment with Business Goals
Evaluate whether reported KPIs continue aligning with evolving business goals or if adjustments are necessary as priorities shift.
Common Challenges in KPI Reporting and How to Overcome Them
Despite their benefits, organizations may face challenges when implementing KPI reporting:
Challenge: Choosing the Wrong KPIs
Selecting irrelevant or too many KPIs can lead to confusion or information overload. Focus on a few critical metrics aligned with strategic objectives.
Challenge: Data Quality Issues
Inaccurate or inconsistent data can compromise reporting effectiveness. Establish robust data governance practices to ensure high-quality inputs for your KPIs.
Challenge: Misinterpretation of KPIs
Without proper context or explanation, stakeholders may misinterpret what certain KPIs indicate about performance. Provide clear narratives alongside each metric for better understanding.
Challenge: Overcomplicating Reports
Complexity can hinder usability; strive for simplicity by presenting only essential information in an easily digestible format while avoiding unnecessary details.
Frequently Asked Questions(FAQs)
How often should I generate KPI reports?
The frequency depends on organizational needs; common intervals include weekly, monthly, or quarterly based on how quickly metrics change or decisions need to be made.
What should I do if my KPIs aren’t meeting targets?
Analyze underlying factors contributing to underperformance; consider adjusting strategies or processes based on insights gained from your reporting analysis.
Conclusion
KPI reports are invaluable tools for organizations seeking to measure success against strategic objectives effectively. By understanding what constitutes effective reporting—defining relevant metrics, ensuring quality data visualization, fostering accessibility across teams—businesses can harness these insights not just as numbers but as actionable guidance driving informed decision-making processes towards achieving their goals.
Related to Business Intelligence