Business Intelligence
Written By: Sajagan Thirugnanam and Austin Levine
Last Updated on November 1, 2024
Introduction
In the realm of business analytics, effective reporting is essential for translating data into actionable insights. Reports serve as vital communication tools that help stakeholders understand performance, identify trends, and make informed decisions.
Type 1: Operational Reports
Source: Medium
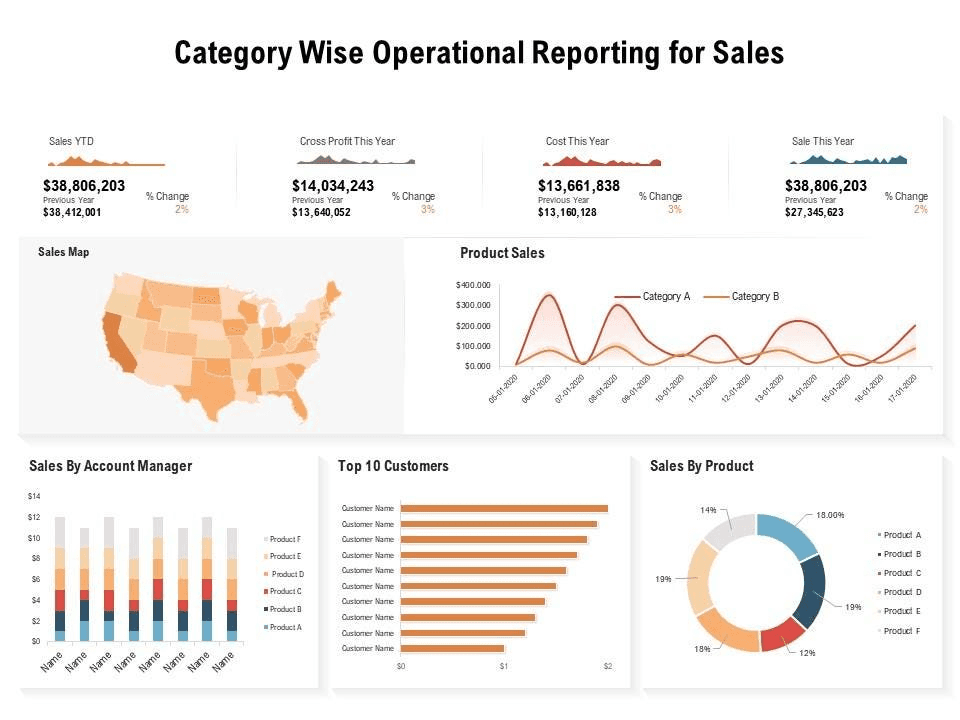
Operational reports are used to monitor the day-to-day activities of an organization. They are typically generated on a regular basis (daily, weekly, or monthly) and provide insights into the performance of ongoing operations.
Key Elements to Include
Performance Metrics: Key performance indicators (KPIs) relevant to daily operations.
Trends Over Time: Historical data comparisons to identify patterns.
Actionable Insights: Recommendations for immediate actions based on current performance.
Example Use Cases
A manufacturing company uses operational reports to track production efficiency and machine downtime.
A retail store generates daily sales reports to monitor inventory levels and sales trends.
Best Practices
Ensure clarity and simplicity in presentation.
Focus on relevant metrics that directly impact operations.
Use visualizations like charts and graphs for easy interpretation.
Type 2: Analytical Reports
Source: LinkedIn
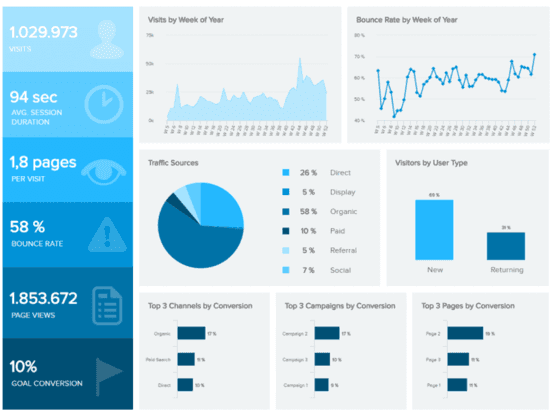
Analytical reports are utilized when deeper analysis is required to understand complex data sets. They often address specific questions or problems identified through operational reporting.
Key Elements to Include
Data Analysis: In-depth examination of data trends and patterns.
Comparative Data: Benchmarks against historical performance or industry standards.
Conclusions and Recommendations: Insights that guide strategic decision-making.
Example Use Cases
A financial analyst prepares an analytical report to assess the profitability of different product lines.
A marketing team analyzes customer behavior data to evaluate the effectiveness of recent campaigns.
Best Practices
Incorporate statistical analysis techniques for robust insights.
Clearly state the methodology used for analysis.
Provide context for findings to enhance understanding.
Type 3: Strategic Reports
Source: YouTube
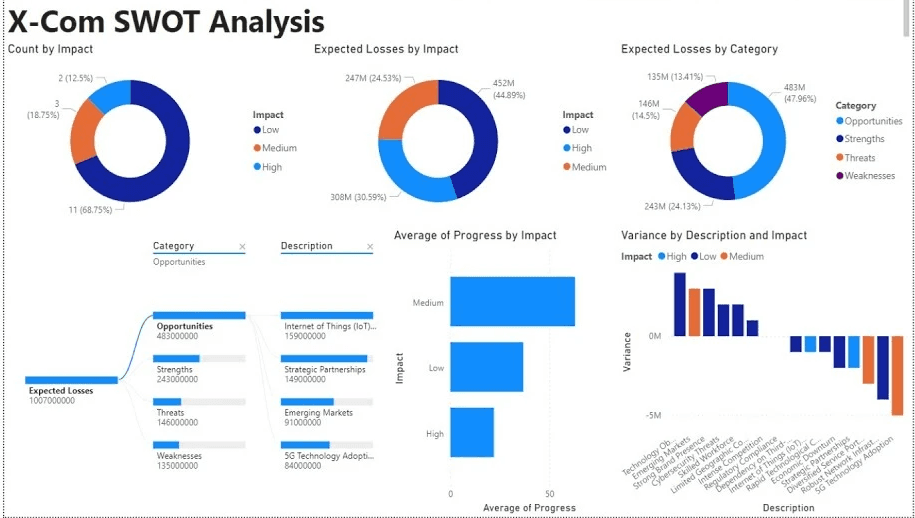
Strategic reports are designed for long-term planning and decision-making. They provide a high-level overview of organizational performance against strategic goals.
Key Elements to Include
Goal Alignment: Assessment of progress toward strategic objectives.
SWOT Analysis: Evaluation of strengths, weaknesses, opportunities, and threats.
Forecasting Data: Projections based on current trends and historical data.
Example Use Cases
An executive team reviews a strategic report quarterly to evaluate overall company performance against annual goals.
A non-profit organization assesses its impact through strategic reporting aligned with its mission objectives.
Best Practices
Focus on long-term implications rather than short-term fluctuations.
Engage stakeholders in the report creation process for broader perspectives.
Use clear visuals to summarize complex information effectively.
Type 4: Financial Reports
Source: ZoomCharts
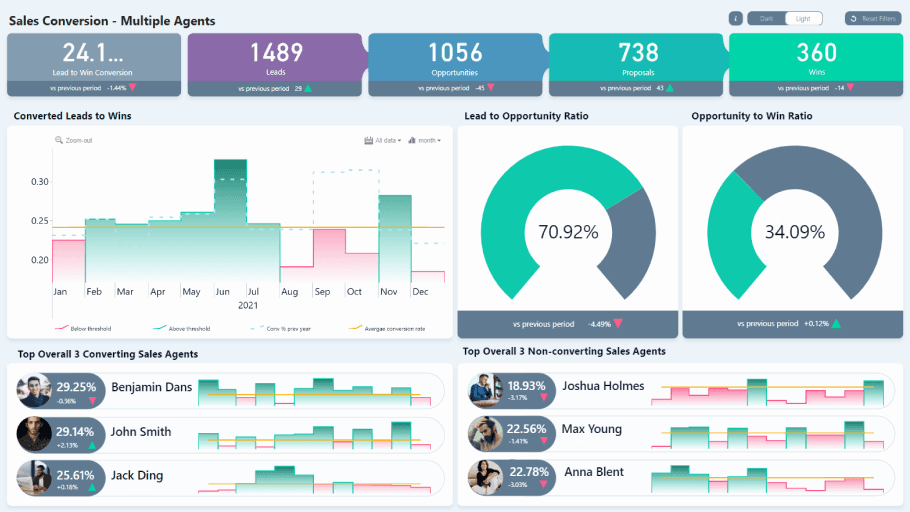
Financial reports are essential for tracking an organization’s financial health. They are typically prepared on a monthly or quarterly basis and are crucial for stakeholders who need insights into financial performance.
Key Elements to Include
Income Statements: Overview of revenues, costs, and profits over a specific period.
Balance Sheets: Snapshot of assets, liabilities, and equity at a given time.
Cash Flow Statements: Analysis of cash inflows and outflows.
Example Use Cases
A CFO presents quarterly financial reports to the board of directors to discuss financial performance and budget adjustments.
A small business owner reviews monthly financial statements to assess profitability and cash flow management.
Best Practices
Ensure compliance with accounting standards (e.g., GAAP or IFRS).
Highlight key variances from budgeted figures with explanations.
Provide forecasts based on historical financial data.
Type 5: Marketing and Sales Reports
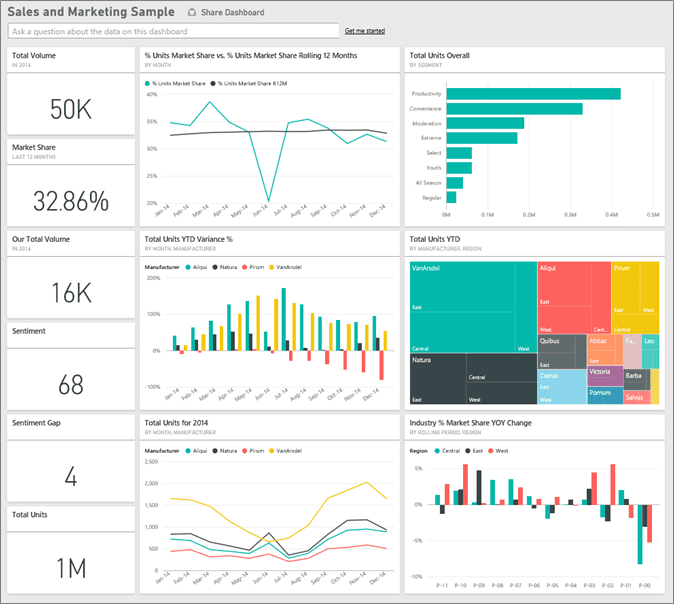
Source: Microsoft Learn
Marketing and sales reports are used to evaluate the effectiveness of marketing strategies and sales initiatives. These reports help teams understand customer engagement and revenue generation processes.
Key Elements to Include
Sales Metrics: Total sales volume, conversion rates, customer acquisition costs.
Marketing Performance Metrics: Campaign ROI, lead generation statistics, customer engagement rates.
Market Trends Analysis: Insights into market conditions affecting sales and marketing strategies.
Example Use Cases
A marketing team analyzes campaign performance through detailed reports that measure engagement metrics across various channels.
A sales manager reviews monthly sales reports to identify top-performing products and areas needing improvement.
Best Practices
Segment data by demographics or channels for more granular insights.
Utilize visualizations like funnel charts or heat maps for clarity.
Regularly update stakeholders on changes in market conditions or consumer behavior.
How to Choose the Right Report for Your Business Needs
Selecting the appropriate type of report depends on your specific business needs. Consider factors such as:
Objective Alignment: Ensure the report type aligns with your business objectives (operational efficiency vs. strategic planning).
Audience Needs: Tailor reports based on who will be using them—executives may require high-level summaries while operational teams need detailed metrics.
Data Availability: Assess what data is available and how it can be best utilized in different report formats.
Steps to Create a High-Quality Business Analytics Report
Define Your Purpose: Clearly outline what you aim to achieve with the report.
Identify Key Metrics: Select relevant KPIs that align with your objectives.
Collect Data Efficiently: Gather accurate data from reliable sources while ensuring consistency in reporting periods.
Design Layout Thoughtfully: Create an intuitive layout that highlights key findings effectively using visual aids where necessary.
Review for Accuracy and Clarity: Ensure all information is accurate, well-organized, and easy for stakeholders to understand before distribution.
Conclusion
Understanding the different types of report writing in business analytics is crucial for effective decision-making. Each report type—operational, analytical, strategic, financial, and marketing/sales—serves distinct purposes that cater to various aspects of organizational performance.
Related to Business Intelligence