Advanced Power BI
Written By: Sajagan Thirugnanam and Austin Levine
Last Updated on December 23, 2025
Power BI is a powerful business intelligence tool developed by Microsoft, designed to transform raw data into meaningful insights and visualizations for informed decision-making. It offers a wide range of data analysis capabilities, including data modeling, data transformation, and advanced analytics, empowering users to uncover hidden patterns and trends in their data. In this article we will mainly focus on how to make the best out of your report by building a robust data model and following these steps for a clean and easy-to-use report.
Let’s first define what we mean by data modelling. Data modelling is the process of organizing data into a logical and consistent structure. This structure makes it easier to understand, analyze, and report on data. Power BI is a powerful business intelligence tool that can be used to create data models.
A significant point to underline is that Power BI works best when creating a star schema. The star schema structure keeps things simple and efficient. Instead of having data spread out everywhere, the star schema brings the main fact or facts table right to the center, surrounded by smaller dimension tables. This way, when you want to analyze your data, Power BI can quickly navigate through the connected stars to fetch the relevant information
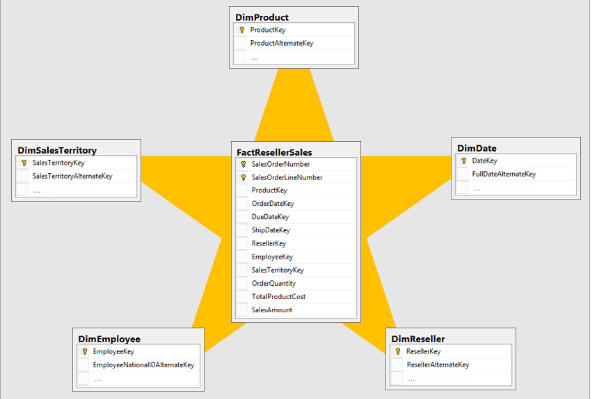
Source: microsoft.com
How to connect tables in Power BI
The main way to connect tables in Power BI is through relationships. Relationships play a key role in connecting different data tables in a friendly and efficient way. Think about them as special bonds between tables that define how they relate to each other. By setting up these relationships, you can avoid data confusion and ensure that your visuals and calculations display accurate information. It is crucial to have a good understanding of your data before starting to connect tables. There are three types of relationships in Power BI:
One-to-one relationships link a unique value in one table to a unique value in another, like a personal ID connecting to a specific person's details.
One-to-many relationships link a single value in one table to multiple matching values in another, such as a product ID appearing in multiple sales records.
Many-to-many relationships are less common but still useful for connecting multiple values from one table to multiple values in another, often through a bridge table.
You can let Power BI detect automatically these relationships or you can manually create or modify them to suit your data model.
How to connect columns from fact and dimensions
Another key factor for efficient and effective data modeling is to also connect IDs. Try to avoid creating relationships based on columns that include texts. Every dimension should have an ID column, if it does not have one, you can create one by using the auto-index functionality of Power Query. The process for that is the following:
Open Power Query by clicking on the Transform Data at the Home ribbon
Select the dimension you want to create the unique key
Click on the Add Column ribbon at the top of the page
Click on the Add Index option
Click on the drop down menu and choose the most convenient option for you
Remember the above process is to make sure that all the dimensions have unique IDs, which means that you need to repeat the same process for the rest of your dimensions.
After creating all the ID for your dimensions, it is time to move to the fact table. The most appropriate process for connecting the fact with the dimensions is to replace all the text columns with the IDs you created before. The process is as follows:
Again open Power Query
Select your fact table
From the home ribbon, click on the merge queries at the right hand side
Select the dimension you want to connect it with
Select the common column
Specify the type of join
After merging the two tables, you need to expand the columns and bring the unique ID of the respective dimension
Rename the column
Delete the text column and keep only the ID column
Close and apply all your steps
Now, you are ready to connect the fact table with the relevant dimension table through an ID column.
And since we are in the Power Query environment, it is very important to always go back and rename your steps in a way which would make sense to other users. It is crucial to not neglect this step and name your Power Query steps properly. Always keep in mind that your report will be consumed by other people, and every step of the process needs to be clear to them too.
Tips and Tricks for Power Query
Besides that some other advices regarding Power Query are the following:
Try to delete all the unnecessary columns in order to not load unused data in the memory of Power BI
Reorder the columns, so that the IDs or the foreign keys are first and then the rest of the columns follow
Change the type of the data as a last step, when it is applicable
Try to combine steps, instead of repeating the same process over and over again
Instead of Removing columns, try to select them. You can achieve that by selecting the column you want to keep and on the home ribbon select Remove Other Columns
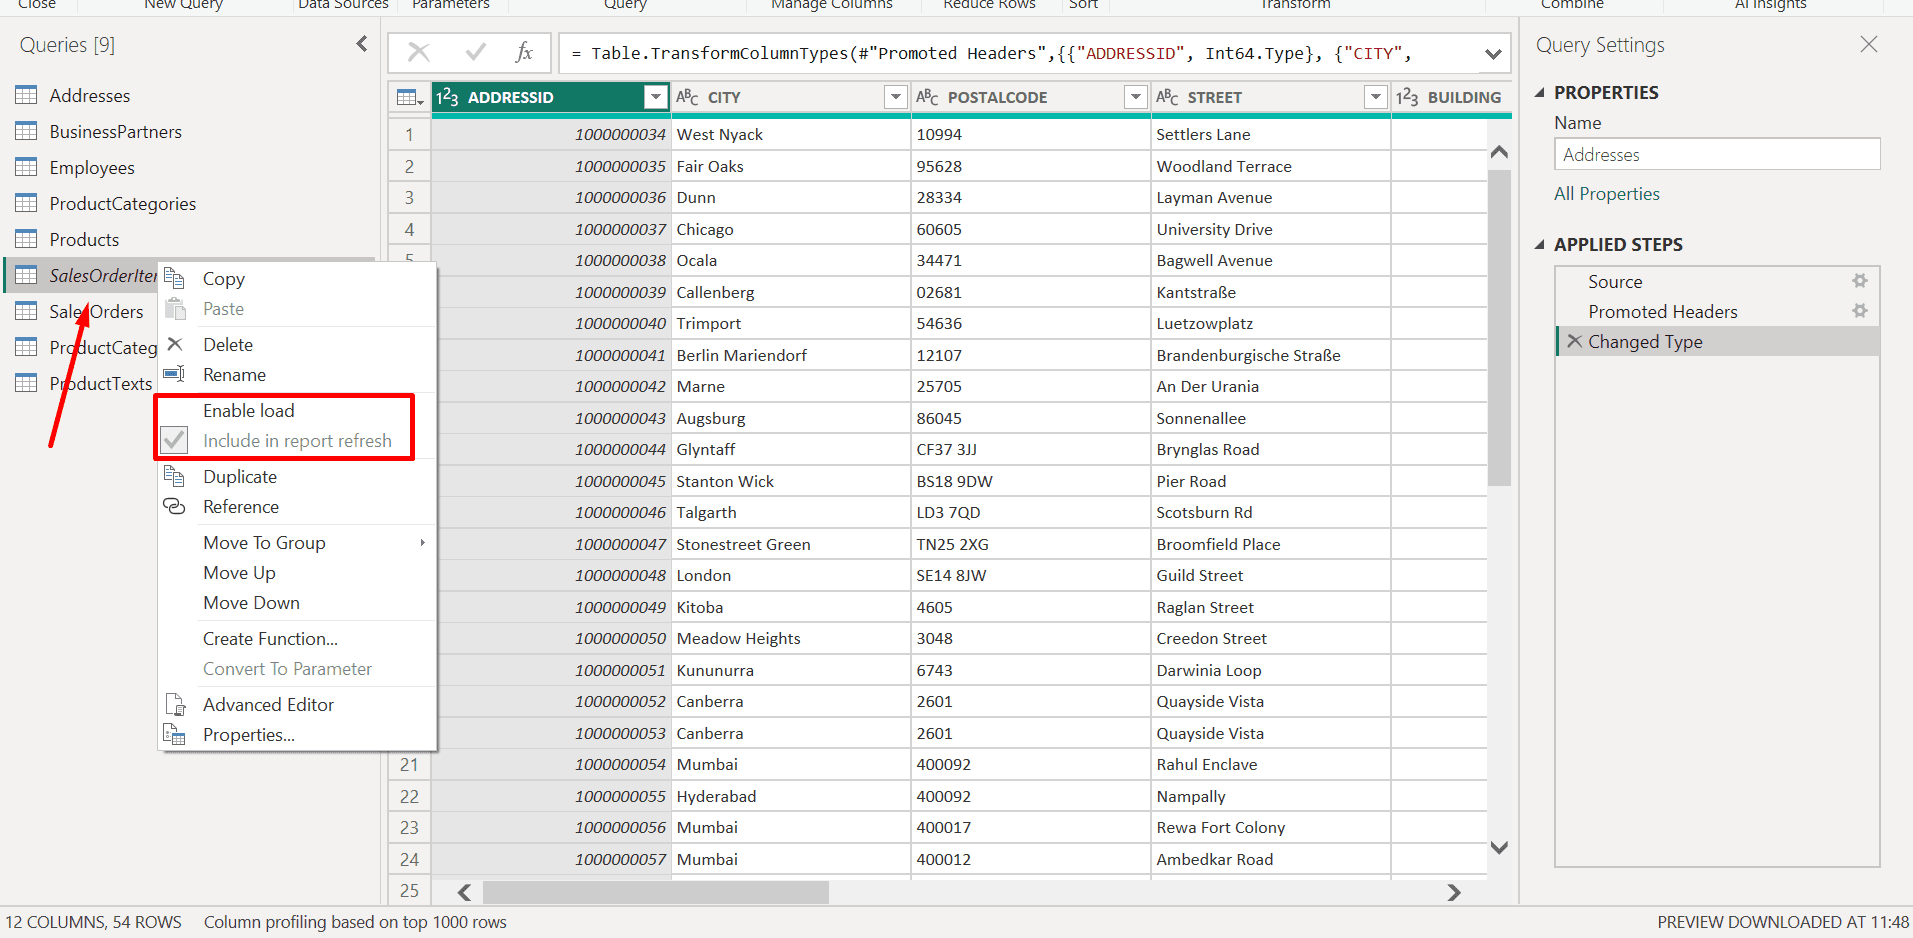
Another crucial step to take in order to not only avoid overloading your data model but also to make your report clean and clear for other users is to disable the loading of tables that you do not need. This will dramatically improve your report's performance. There are many cases in which we use tables that ultimately append to a new query, but serve no other purpose. The rule of thumb is to consume as little memory as possible, and you can achieve that by following the disable load step. Here is how you can do that:
Open Power Query. Right-click on the table that you do not need in your model.
By default, the option Enable Load is selected.
You need to click on it.
You can be assured that the specific table is not loaded into the data model because its name will be displayed in an acrylic font.
How to structure properly the measures
Once you have applied all the steps above, try to rename all your tables in a self-explanatory way. On top of that, in the data model section of Power BI, try to hide all the columns that you are not going to use in your report. This leads to a cleaner report.
The last step to proper data modeling is to structure your measures. Instead of having a general measures table, the approach wed follow is to create all the measures in the respective fact and keep only these as visible columns. With this approach, you implicitly create measure tables for each of your facts. Another significant thing to have a clean report and a proper data model is to stick to logical and simple name conventions. Try to name your measures in a way that is understandable to everyone. Lastly, it is important to create folders and sub-folders to group your measures. If you want to create folders for your measures:
Open the data modeling tab in Power BI
On the right hand side click on the measure
Open the Properties tab
On the Display folder you can write the name of your folders
If you want to create sub folders, you can use the back slash, eg [Name of Folder] \ [Name of the Sub folder ]

Using Calculated Columns and Measures
The creation of calculated columns and measures in Power BI requires DAX (Data Analysis Expressions) but these elements function differently so users need to apply proper usage for maintaining an efficient data model.
The system performs row-by-row evaluations of calculated columns during data refresh operations which result in memory-based model storage. The system operates most effectively when users perform static logical operations which remain constant throughout their interaction with the system. The system operates best for static logic which remains unchanging during user interactions because it handles tasks like categorization and flagging and surrogate key management. The data model size increases when you use calculated columns so you should apply them only when the row-level logic requires their existence.
The system evaluates Measures through query-time operations which generate dynamic responses based on user interactions with filters and slicers and report selections. The system uses these measures instead of calculated columns because they do not require additional memory space which makes them suitable for aggregations and KPIs and ratios and time-based calculations. The best practice requires users to select measure implementation for calculations which should replace calculated column usage.
Continuous Model Optimization and Monitoring
The process of creating an organized data model requires ongoing effort. The growing amount of data requires organizations to optimize their systems continuously while monitoring their performance because business needs change and reports need to handle increasing complexity.
The process of reviewing your data model on a regular basis enables you to detect performance issues which stem from unused tables and redundant columns and complex measures and unnecessary database relationships. The removal or reorganization of these elements will decrease memory consumption while making reports more responsive. The Performance Analyzer tool in Power BI enables users to determine which visual elements and measurement components use the most system resources.
The system requires continuous tracking of model performance throughout its operational period. The performance of the system becomes affected when source systems experience changes or when refresh schedules or user interaction patterns shift from their original state. Your data model needs periodic checks to maintain its alignment with business requirements and industry best practices.
The essential optimization practices which users should adopt are:
The process requires users to inspect and remove all unnecessary columns and tables and measures.
The process of simplifying complex DAX calculations needs to occur when these formulas become difficult to sustain.
The system needs to verify how relationships and cardinality values change when fresh data becomes available.
The system requires continuous tracking of refresh times together with visual performance assessment following any substantial system modifications.
Your Power BI reports will maintain their speed and scalability and reliability through continuous data modeling because this approach avoids treating it as a completed process.
Conclusion
And there you have it! We've taken a journey through the best practices for data modeling in Power BI. So, go ahead and embrace these practices, and watch as your Power BI experience reaches new heights of awesomeness!
Frequently Asked Questions (FAQs)
1. When should I use calculated columns instead of measures in Power BI?
Calculated columns should be used when you need row-level logic that does not change based on user interaction, such as classifications, flags, or keys used for relationships. Measures are better suited for dynamic calculations like totals, ratios, and KPIs because they respond to filters and do not increase model size.
2. How do calculated columns and measures affect Power BI performance?
Calculated columns consume memory because they are stored in the data model, which can impact performance if overused. Measures are calculated at query time and are generally more efficient. Using measures whenever possible helps keep the data model lean and improves report responsiveness.
Related to Advanced Power BI