DAX and Data Modeling
Written By: Sajagan Thirugnanam
Last Updated on September 23, 2026
CALCULATE is the DAX function that evaluates an expression, usually a sum or a count, under filters you choose. You give it the expression first and then one or more filters, for example CALCULATE ( SUM ( Sales[Sales Amount] ), Sales[Product Type] = "Electronics" ). Power BI adds those filters to whatever the report is already filtering by, or replaces the existing filter when it is on the same column, and then calculates the result.
Almost every non-trivial measure in a Power BI report uses it: sales for one region, prior-year revenue, a share of the total.
What is Power BI Calculate Function?
The closest Excel equivalent is SUMIF. SUMIF adds up a column only for the rows that meet a condition. CALCULATE does the same job, with two differences:
The condition can sit on any table in the model. A filter on the Customer table reaches the Sales table through the relationship between them.
It works with any expression, not only a sum. It can wrap COUNT, AVERAGE, DISTINCTCOUNT or another measure.
An Example of How Calculate Function Works
With CALCULATE you can return total profit for one city, total revenue for one product, or sales for one year, all from the same Sales table. Each is the same aggregation with a different filter. The syntax below is what makes that possible.
Basic Syntax of the Calculate Function
CALCULATE has two parts: the expression and the filters.
The expression is what you want to calculate, for example
SUM ( Sales[Sales Amount] )or an existing measure such as[Total Sales].The filters are optional and separated by commas. When you pass several, all of them apply at once, like AND.
A filter argument can take one of three forms:
Filter form | Example | Use it for |
|---|---|---|
Boolean expression |
| Simple conditions on columns of one table. The fastest option. |
Table expression |
| Conditions that need a measure or compare columns across tables. |
Filter modifier |
| Removing filters, keeping existing filters, or switching relationships. |
A Boolean filter can reference columns from one table only. It cannot reference a measure and cannot contain another CALCULATE. When you need either, use FILTER.
How to use the Calculate Function in Power BI?
In the Data pane, right-click the table that should hold the new measure and select New measure. A dedicated measures table is a good home for it.
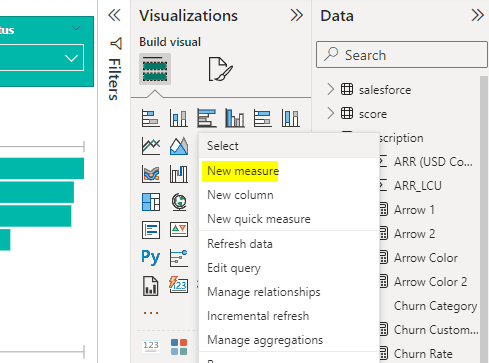
Right-click a table in the Data pane > New measure.
In the formula bar, type the measure name, an equals sign and the CALCULATE expression, then press Enter.
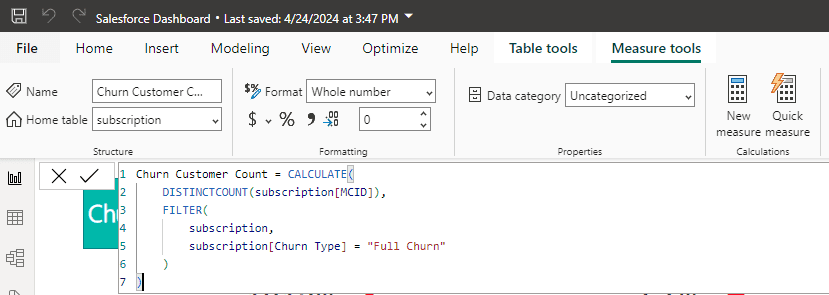
A CALCULATE measure in the formula bar, with the Measure tools ribbon above it.
Use the Measure tools ribbon to set the format, for example Whole number or Percentage. The measure then appears in the Data pane under the table you chose.
The measure in the screenshot counts customers with a full churn:
It works, but FILTER walks every row of the subscription table. Microsoft recommends a Boolean filter wherever one is possible, because the engine filters a single column much faster. KEEPFILTERS makes it behave like the FILTER version when a slicer is also set on Churn Type:
When to use the Calculate Function
Use CALCULATE whenever a measure needs a filter that the report does not already apply. Take a table named Sales with three columns: Product Type, Sales Amount and Date. To return sales of Electronics in 2023:
SUM ( Sales[Sales Amount] )is the expression.Sales[Product Type] = "Electronics"keeps only Electronics rows.YEAR ( Sales[Date] ) = 2023keeps only rows dated in 2023.
If the model has a date table, filter it instead, for example 'Date'[Year] = 2023. That filter reaches every fact table related to the date table.
What happens to slicers on the same column
A filter argument replaces any existing filter on the same column. If a report reader selects Furniture in a Product Type slicer, Electronics_Sales_2023 still shows Electronics sales. Its filter on Product Type overrides the slicer. Filters on other columns, such as Region, still apply.
That is right for a fixed benchmark and wrong for a measure that should follow the slicer. Wrap the filter in KEEPFILTERS to add it on top of the slicer instead:
With Furniture selected, this version returns blank, because no row is both Furniture and Electronics. The row context vs filter context post explains where the existing filters come from.
Another Real World Use Case of the Calculate Function
Filters can sit on different tables. To return revenue from customers in City A who are over 45:
Both filters are on the Customer table, and the relationship from Customer to Sales carries them to the revenue rows.
CALCULATE also removes filters. This measure divides by revenue with every filter on the Customer table cleared, so each row of a visual shows its share of revenue from all customers:
For a total that still respects the slicers, see ALLSELECTED vs ALL.
Closing Remarks
Start with the Boolean filter form and reach for FILTER only when a condition needs a measure or columns from two tables. Test each new CALCULATE measure with a slicer set on the column it filters, so you see whether it should replace the slicer or respect it. If a CALCULATE measure is slow, the DAX performance guide covers the usual causes. The SUM vs SUMX post covers the aggregations you will most often put inside it.
FAQs
Does CALCULATE affect the entire report or only specific measures?
Only the measure it is written in. CALCULATE changes the filters for its own expression and nothing else. Other measures and visuals are unaffected, unless another measure references this one, in which case it returns this measure's filtered result.
Can I nest Calculate Function?
Yes. The inner CALCULATE is evaluated inside the filters the outer one sets. When both filter the same column, the inner filter wins. Nesting is valid but hard to read. Two filter arguments in one CALCULATE, or a variable holding the inner result, is usually clearer.
Can I use multiple filter arguments with the Calculate Function?
Yes. Separate them with commas, as in the examples above. All of them apply at the same time, so a row must meet every condition.
Does Calculate support logical operators like AND, OR, NOT?
Yes, with limits. Inside one Boolean filter you can use &&, || and NOT, as long as every column comes from the same table:
For an OR across columns from two different tables, use FILTER over a table that can reach both columns, for example FILTER ( Sales, RELATED ( Customer[City] ) = "City A" || Sales[Revenue] > 1000 ).
Sources
CALCULATE function (DAX) - Microsoft Learn
Avoid using FILTER as a filter argument in DAX - Microsoft Learn
Related to DAX and Data Modeling