Reports and Dashboards
Written By: Sajagan Thirugnanam
Last Updated on September 23, 2026
To show when a Power BI report last refreshed, add a one-row table in Power Query that records the current time, load it into the model, and display it on a card. The time is captured every time the semantic model refreshes, so the card always shows the latest refresh. After publishing, the service records this time in UTC, so convert it or label it, as shown below.
Why show the last refresh date
Readers trust the numbers. They can see whether the data came from the latest scheduled refresh or is several days old.
Missed refreshes show up. If a scheduled refresh fails, the date on the card stops moving, and readers notice before a decision is made on stale data.
Refresh problems are easier to trace. A date that lags the schedule is the first sign a refresh is failing or taking too long.
How to add the last refresh date
In Power BI Desktop, select Transform data on the Home ribbon to open Power Query Editor.
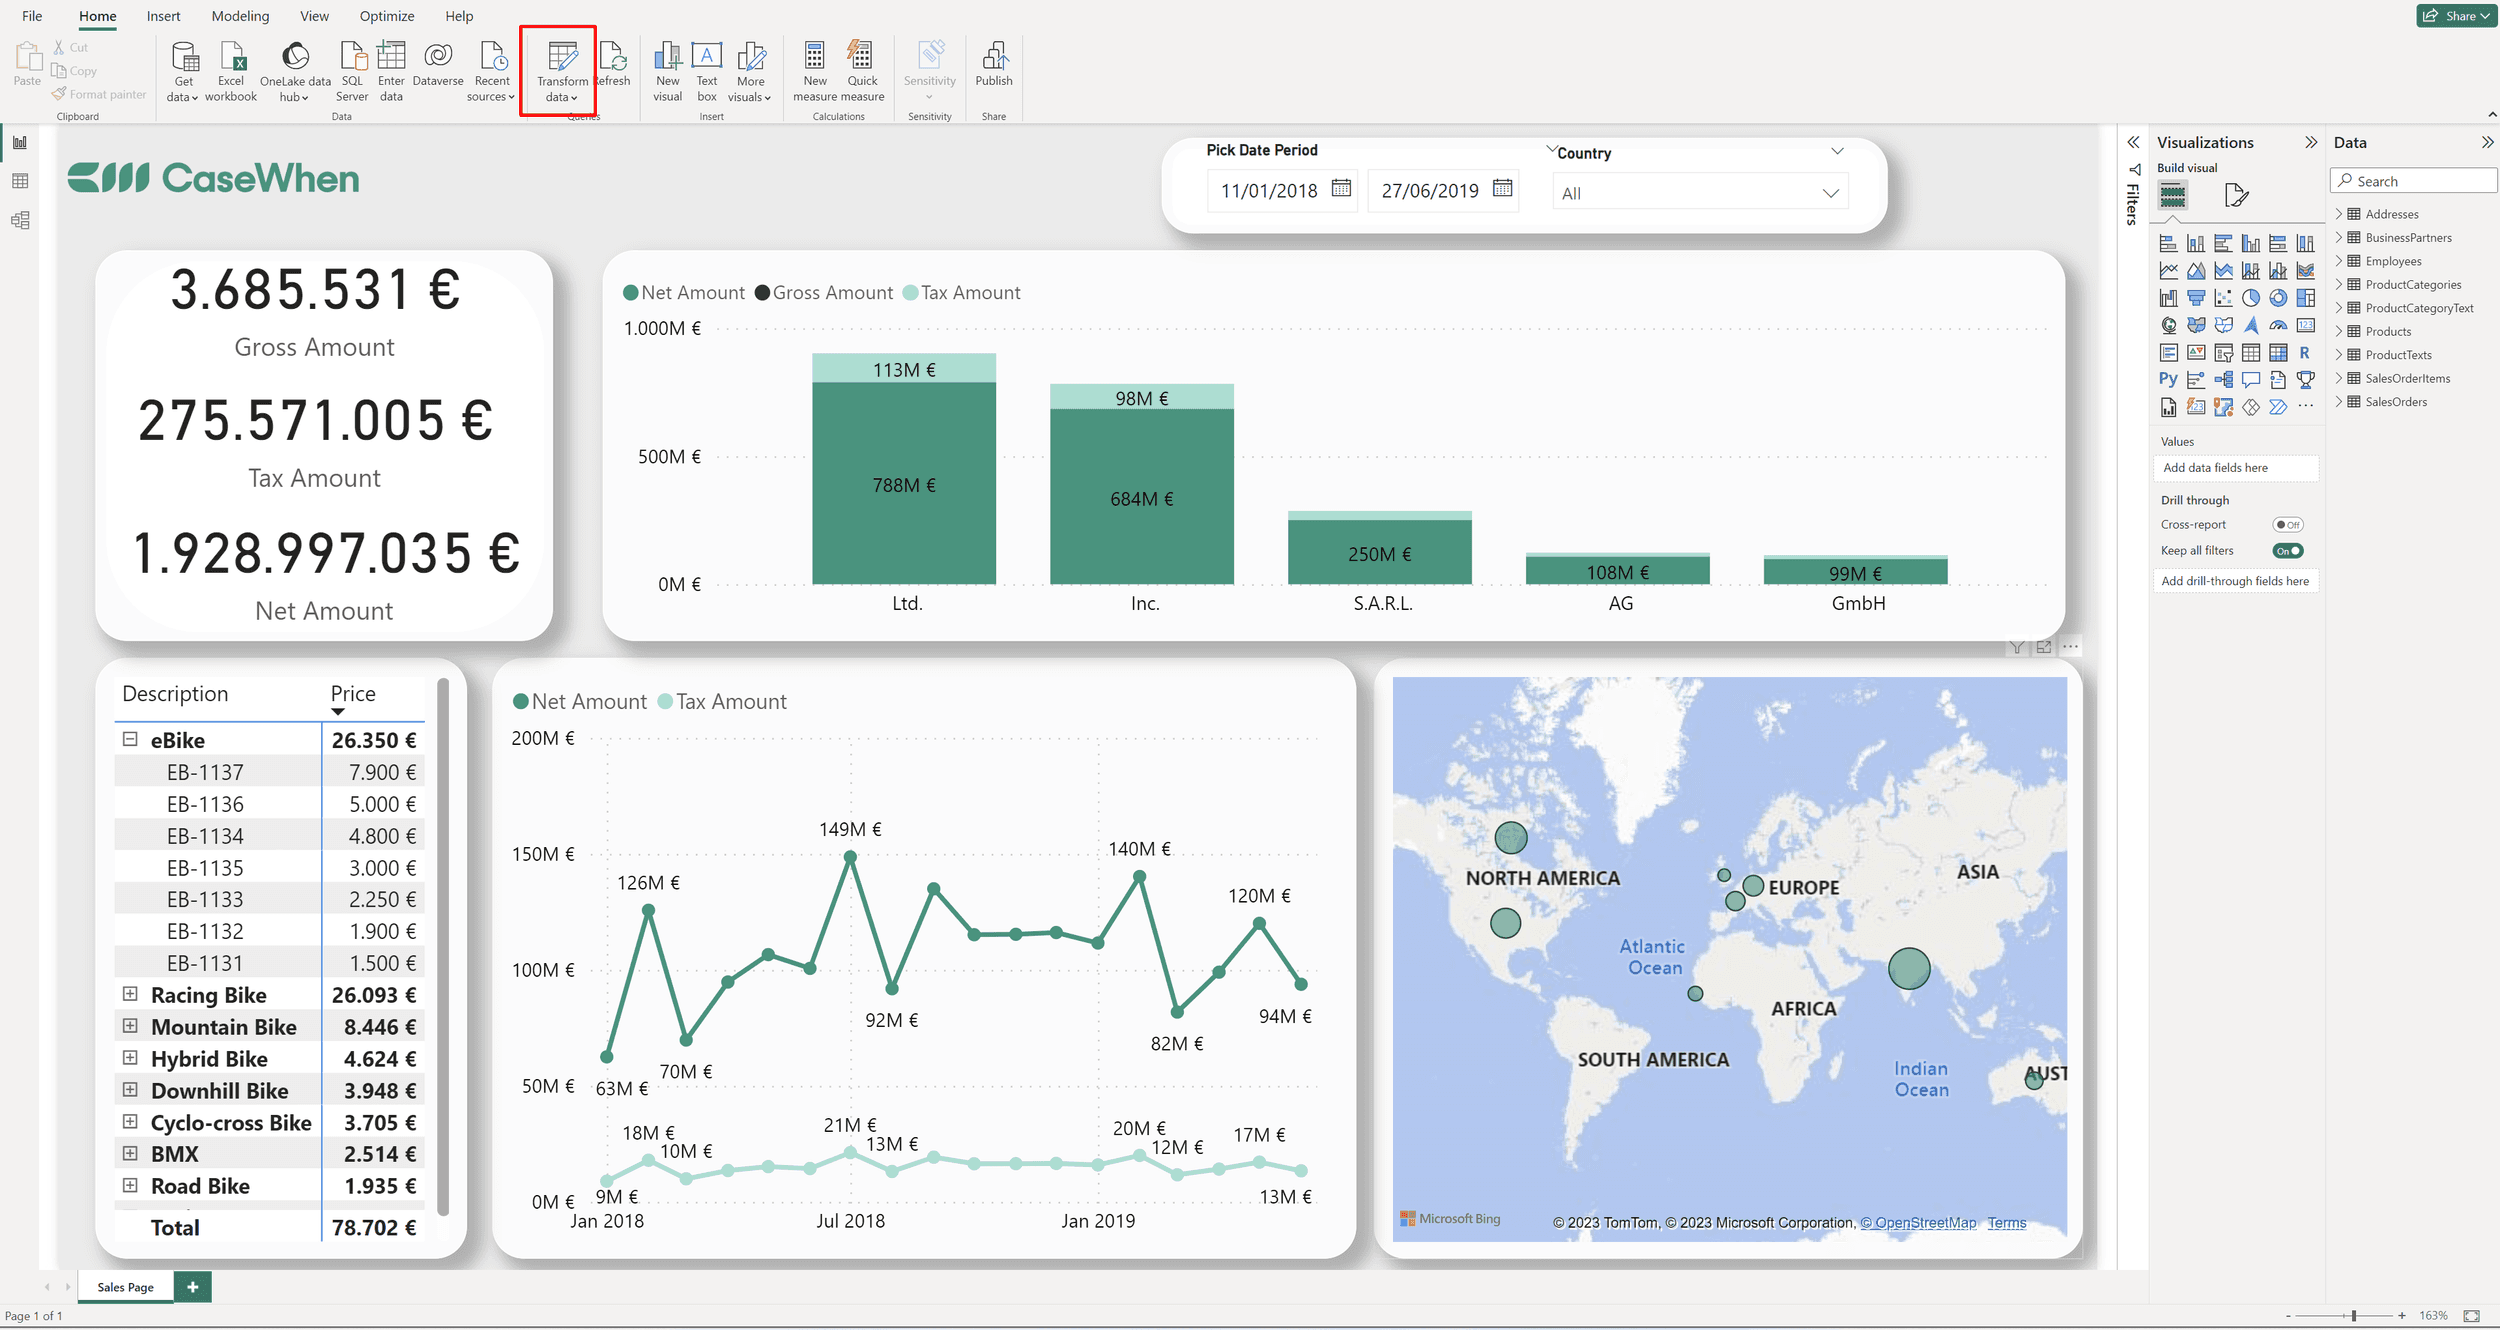
Power BI Desktop > Home > Transform data.
Select New Source > Blank Query.
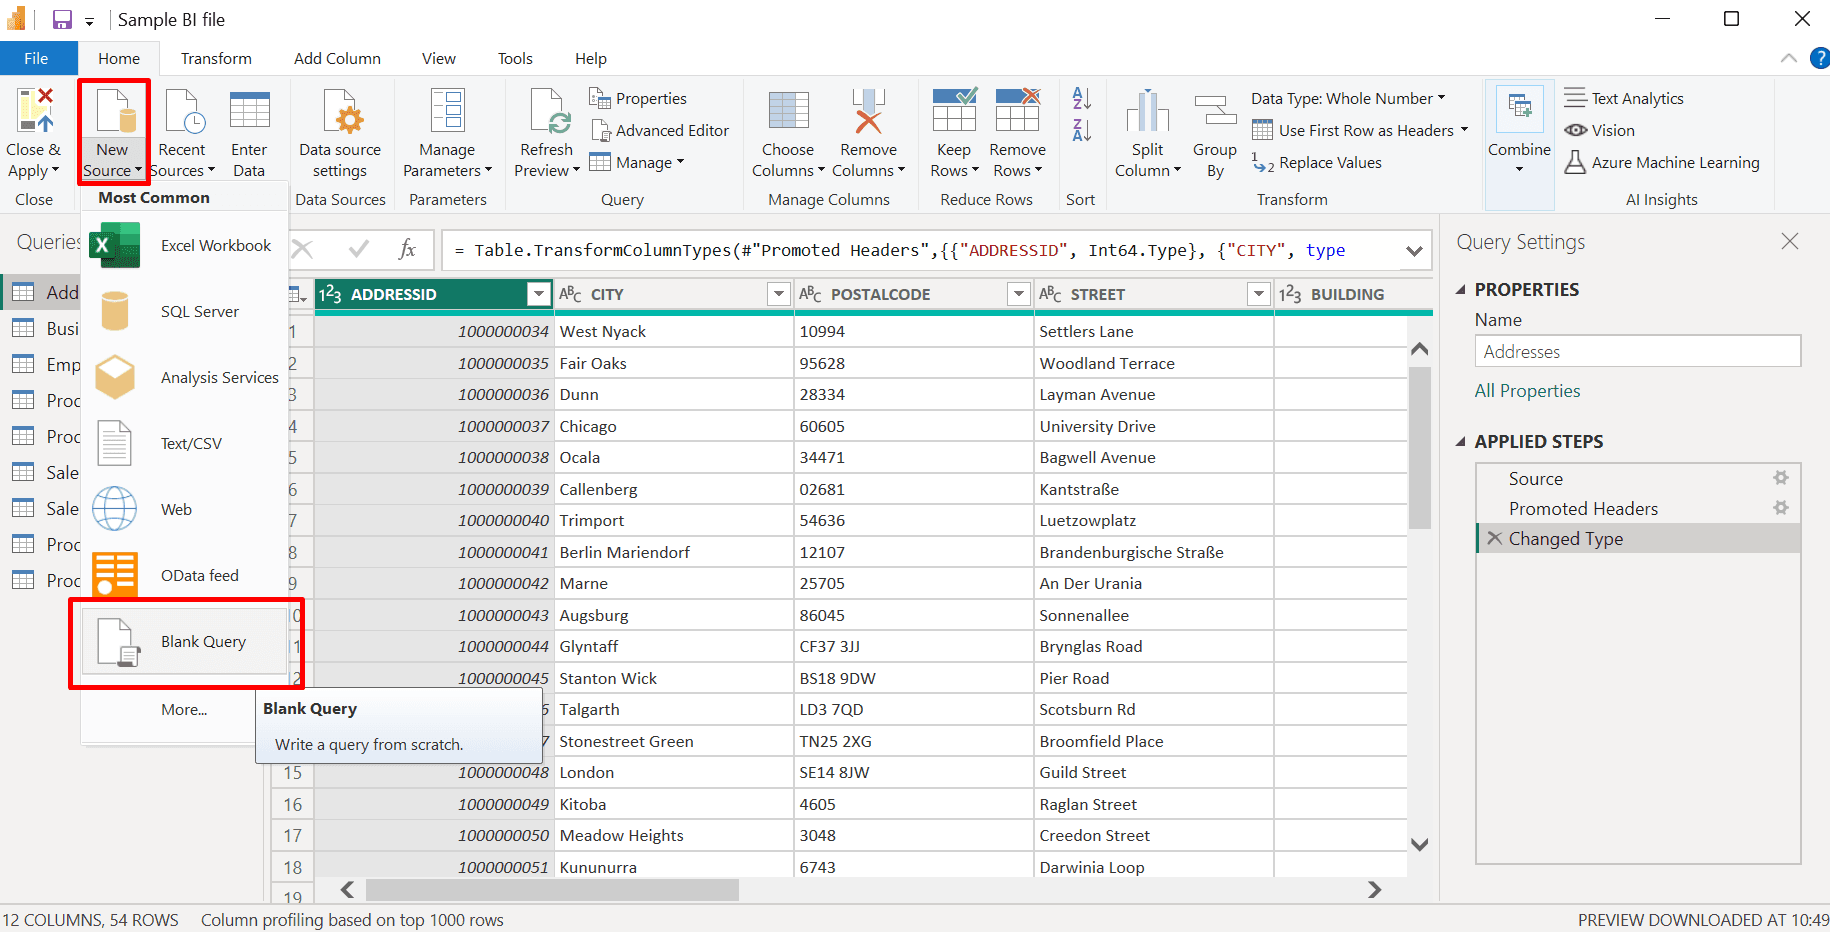
Power Query Editor > Home > New Source > Blank Query.
Right-click the new query, select Rename, and name it
Last Refreshed Date.Select Advanced Editor on the Home ribbon, replace the contents with the code below, and select Done.
#table builds a table from a column definition and a list of rows. Here it is one column of type datetime and one row holding the time the query runs.
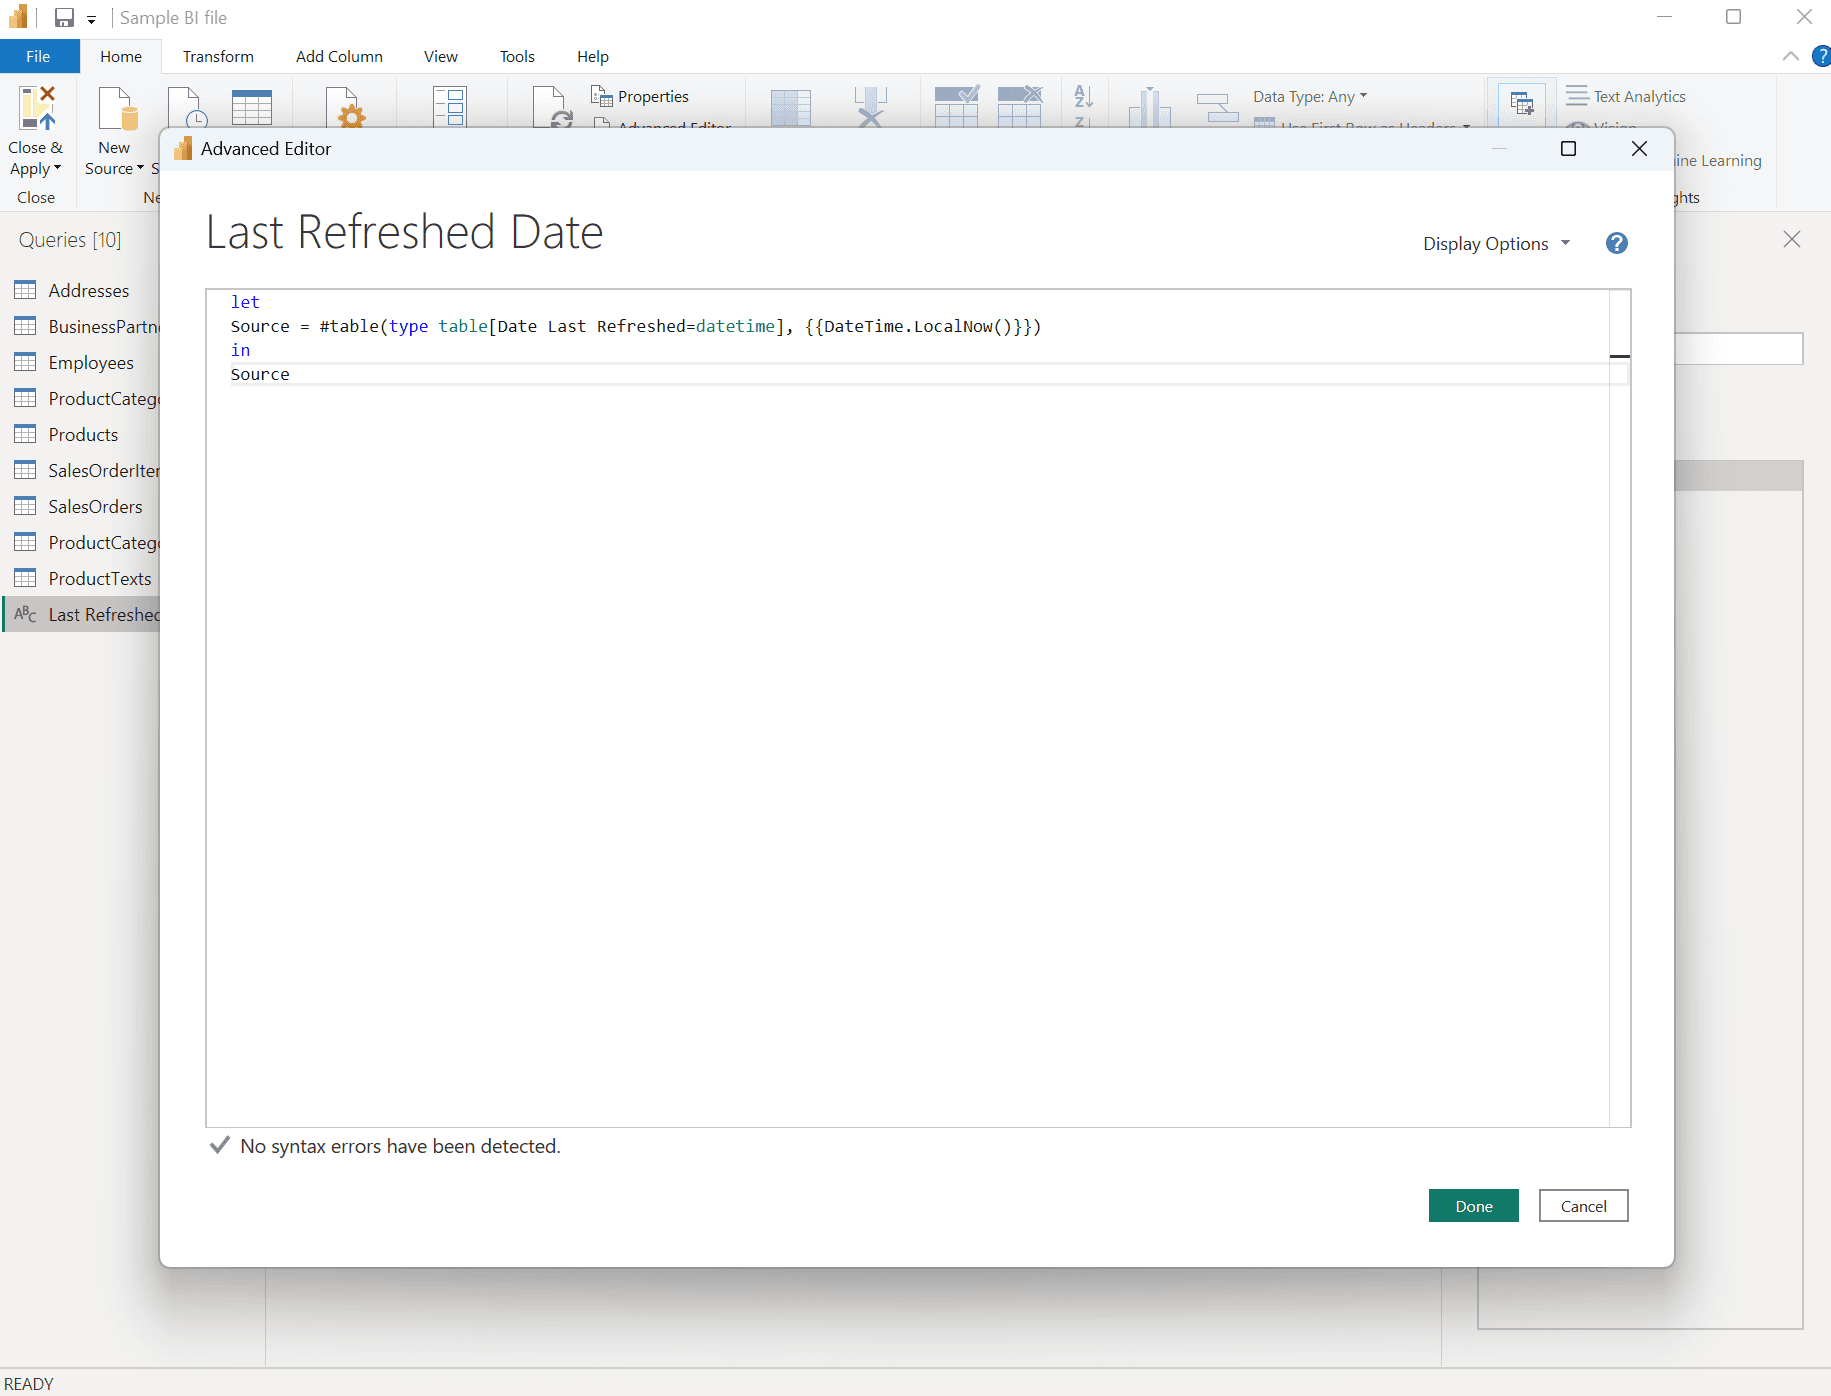
The Advanced Editor with the query in place.
Select Close & Apply.
On the report page, add a Card visual and put Date Last Refreshed in its field well. Format it to fit the report.
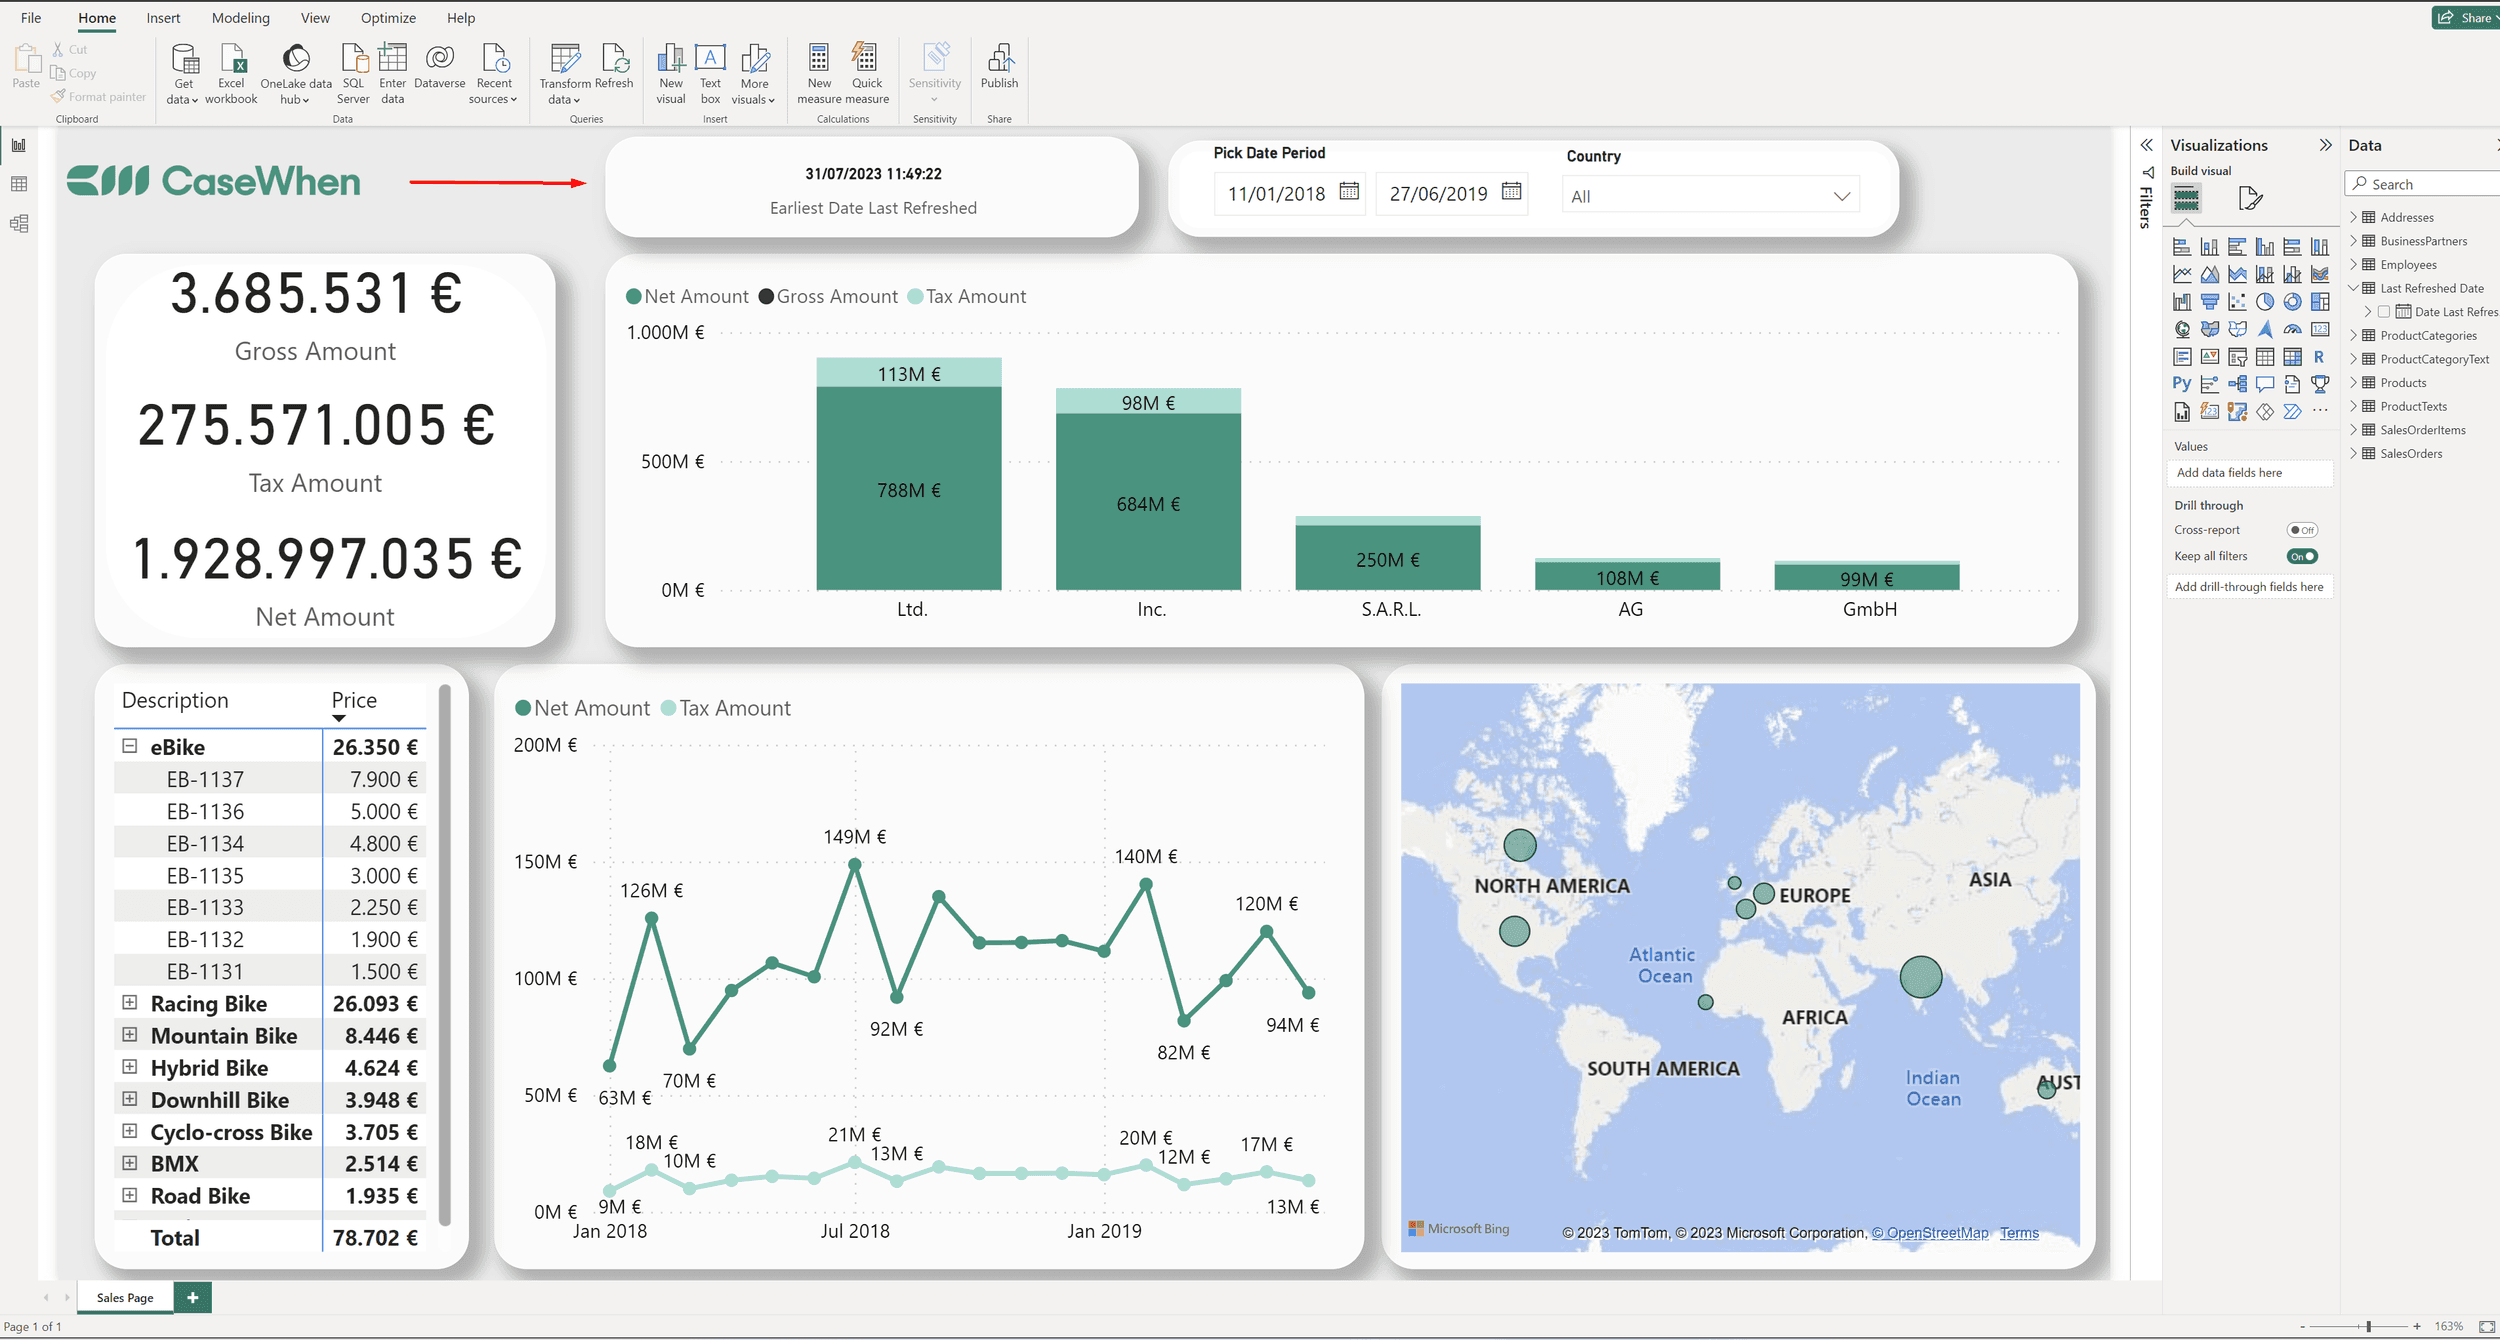
The finished card at the top of the report page, next to the slicers.
Fix the time zone after publishing
In Power BI Desktop, DateTime.LocalNow() returns your computer's local time. In the Power BI service, refresh runs in UTC, so the same code returns UTC. A report refreshed at 06:00 in Berlin during summer time shows 04:00.
To show a local time, start from UTC and apply the offset you want:
SwitchZone(RefreshedUtc, 1) moves the time to UTC+1, and RemoveZone drops the offset so the column loads as a plain datetime. Because it starts from UTC, it returns the same result in Desktop and in the service.
A fixed offset does not follow daylight saving time, so this is one hour off for part of the year in most of Europe and North America. If readers are spread across time zones, or the hour matters, keep UTC and say so on the card. Replace DateTime.LocalNow() with DateTimeZone.RemoveZone(DateTimeZone.UtcNow()) and label the card "Refreshed (UTC)".
Show it as a label
A card showing a bare timestamp can confuse readers. A measure turns it into a sentence:
Put the measure on a card or in a text box in the page header. The ISO date format reads the same way in every country.
Refresh time is not data freshness
The refresh time says when Power BI last loaded the data. It does not say how current the source was. If the source system stopped updating two days before the refresh, the card still shows the refresh time.
When that matters, show the latest date in the data as well:
A report that shows "Data refreshed 2026-03-02 06:00" next to "Latest order 2026-02-28" tells readers exactly what they are looking at.
How it behaves with dataflows and incremental refresh
Dataflows. If the model reads from a dataflow, the card shows when the model refreshed, not when the dataflow did. If the dataflow runs late, the model can refresh on time and still load old data. The latest-date measure above catches that. See how and when to use dataflows.
Incremental refresh. The
Last Refreshed Datetable has no refresh policy, so it reloads fully on every refresh and stays correct. See incremental refresh in Power BI.
Where to put it on the page
Put the card in the same place on every page, usually the header next to the title or the slicers. Keep it small and in a muted color, since it is reference information, not a KPI. For more on page layout, see our guides to dashboard layout and formatting and data visualization best practices in Power BI.
Sources
#table function - Microsoft Learn
DateTimeZone.SwitchZone - Microsoft Learn
Configure incremental refresh and real-time data - Microsoft Learn
Related to Reports and Dashboards