Dashboard Design
Written By: Sajagan Thirugnanam and Austin Levine
Last Updated on October 1, 2024
The digital age has ushered in an era of data abundance, presenting businesses with vast amounts of information that hold the potential to guide strategic decision-making. However, making sense of this data can be a daunting task. This is where data visualization comes into play. By transforming complex data sets into visually engaging representations, data visualization enhances Business Intelligence (BI) insights and enables organizations to unlock the full potential of their data. In this article, we will explore the crucial role of data visualization in enhancing BI insights and its impact on decision-making processes.
The Challenges of Data Analysis in the Digital Age
The digital age has brought about an unprecedented surge in the availability and volume of data. While this abundance of data offers immense opportunities, it also presents several challenges in the field of data analysis. One of the key challenges is the issue of data quality and reliability. With vast amounts of data being generated from various sources, ensuring the accuracy and consistency of the data becomes crucial. For example, social media platforms generate massive amounts of user-generated content, but this data can be subjective, biased, or even intentionally misleading, making it difficult for analysts to draw meaningful insights.
Another challenge in data analysis in the digital age is the complexity of data integration. Organizations collect data from multiple sources, including databases, APIs, social media platforms, and IoT devices. Integrating these diverse datasets and extracting relevant information becomes a complex task. For instance, consider a retail company that wants to analyze customer behavior across different touchpoints, such as in-store purchases, online orders, and mobile app interactions. Integrating and harmonizing these disparate data sources to gain a comprehensive understanding of customer preferences and trends can be a formidable challenge.
Additionally, privacy and ethical concerns pose significant challenges in data analysis. As data collection becomes more pervasive, questions regarding the appropriate use and protection of personal information arise. For example, analyzing healthcare data to improve patient outcomes is valuable, but it raises ethical questions about patient privacy and consent. Striking a balance between extracting insights from data while respecting privacy rights and ensuring compliance with regulations is an ongoing challenge in the digital age
The Art of Data-Driven Storytelling
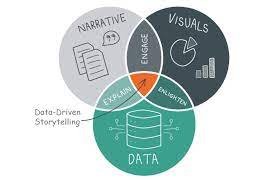
The art of data-driven storytelling is a powerful technique that combines the analytical capabilities of data analysis with the narrative skills of storytelling. It involves transforming complex data into compelling narratives that resonate with the audience. By presenting data in a meaningful and relatable way, data-driven storytelling can communicate insights, influence decision-making, and create emotional connections. Here are some key aspects and examples of this art:
Crafting a compelling narrative:
Identify a central theme or message that aligns with the data insights.
Develop a story arc that engages the audience and builds suspense.
Use characters or case studies to humanize the data and evoke empathy. Example: Hans Rosling's TED Talk "The Best Stats You've Ever Seen" combines captivating storytelling with data visualizations to challenge preconceived notions about global development and highlight the power of data in understanding the world.
Visualizing data effectively:
Choose the right charts, graphs, or infographics to represent data accurately.
Use color, size, and visual cues to emphasize key points and patterns.
Incorporate storytelling elements into data visualizations, such as annotations or captions. Example: The New York Times' "The Upshot" series often uses interactive data visualizations to tell stories about social, economic, and political issues, allowing readers to explore the data themselves and engage with the narrative.
Evoking emotions and creating impact:
Appeal to the audience's emotions by linking the data to personal experiences or larger societal issues.
Highlight the consequences or potential outcomes of the data to generate a sense of urgency.
Incorporate storytelling techniques like suspense, surprise, or humor to captivate the audience. Example: The Guardian's data-driven article "The Counted" used storytelling and data analysis to shed light on police violence in the United States, humanizing the victims and driving awareness and public discourse.
Making data accessible and relatable:
Simplify complex concepts and technical jargon to make the data understandable for a broader audience.
Use storytelling metaphors, analogies, or real-life examples to bridge the gap between data and everyday experiences.
Tailor the narrative to different audience segments, considering their interests and knowledge levels. Example: "Dear Data" is a project where two designers exchanged weekly hand-drawn data visualizations as postcards, transforming mundane personal data into visually engaging stories that resonated with a wide audience.
In conclusion, the art of data-driven storytelling combines the power of data analysis with the narrative techniques of storytelling to communicate insights effectively. By crafting compelling narratives, visualizing data effectively, evoking emotions, and making data accessible, this approach can engage audiences, influence decision-making, and create a deeper understanding and connection with data-driven insights.

Source: phrazor.ai
In conclusion, data visualization plays a pivotal role in enhancing Business Intelligence (BI) insights and driving informed decision-making. It simplifies complex data sets, enabling faster comprehension and revealing patterns and correlations that may otherwise go unnoticed. By transforming raw data into visually appealing representations, data visualization empowers stakeholders at all levels of an organization to explore and interact with data, fostering a deeper understanding of the underlying trends and narratives.
Related to Dashboard Design