Reports and Dashboards
Written By: Sajagan Thirugnanam
Last Updated on September 23, 2026
To set a Power BI fixed column width, select the table or matrix, open the Format pane, go to Visual > Layout > Column width, and set Auto-size behavior to Fixed width. Then enter a Default width in pixels for every column, or turn on Custom widths to set each Power BI table column width separately. The same setting works for a Power BI matrix fixed column width, and it keeps widths locked when the data changes.
Why Power BI table column widths change
By default, a Power BI table sizes each column to fit its content. That sounds helpful, but it causes two problems in real reports:
Columns change width when the data changes. Pick a different month in a slicer and the numbers get longer or shorter, so the columns move.
Matching columns end up different widths. In a matrix with months across the top, one month's Net column can be narrower than the next because its values are shorter. The page looks uneven, and readers cannot scan down a column of equal widths.
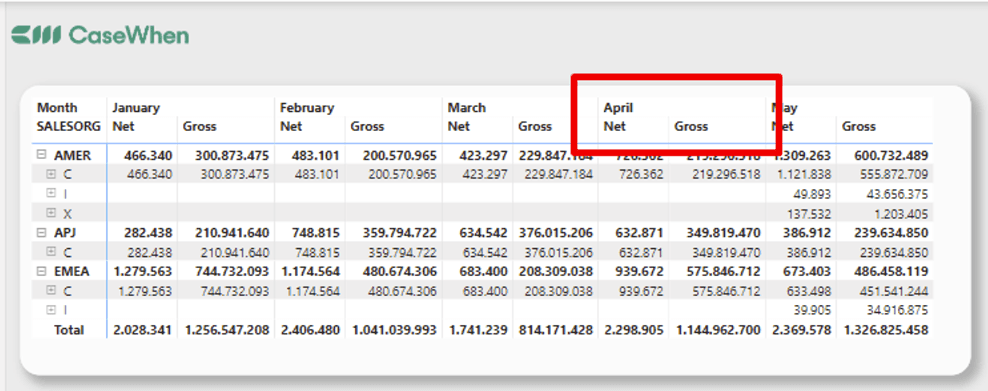
With automatic sizing, one month's Net column is narrower than its Gross column because its values are shorter. The figures are random sample data.
A fixed column width in the Power BI table solves both problems. Every column keeps the width you set, whatever the data shows.
How to set a Power BI fixed column width in a table or matrix
Select the table or matrix visual on the report canvas.
In the Visualizations pane, open Format your visual (the paintbrush icon) and make sure the Visual tab is selected.
Expand Layout, then Column width.
Set Auto-size behavior to Fixed width.
Enter a Default width in pixels.
Every column now uses that width. New columns you add to the visual also get the default width. Headers that are wider than the column can wrap onto a second line if you turn on Text wrap under Column headers > Text.
The three Auto-size behavior options
The Auto-size behavior dropdown controls how Power BI sizes columns when you have not set a width yourself:
Option | What it does | When to use it |
|---|---|---|
Fit to content | Each column is as wide as its content needs, if the visual has room. | Quick exploration, where exact layout does not matter. |
Grow to fit | Columns expand to fill the width of the visual. Leftover space is shared evenly between columns. | When you want the table to fill its container without a gap on the right. |
Fixed width | Every column uses the width you set in Default width. | Reports where columns must line up and stay put. |
If you want a Power BI table to fit its visual's width, choose Grow to fit. If you want to lock column widths, choose Fixed width.
How to set custom widths for individual columns
A single default width does not suit every column. A product name column usually needs more room than a percentage. To set widths one by one:
In Layout > Column width, turn on Custom widths.
Enter a width for each column you want to change.
If the visual has fewer than 15 columns, each column gets its own width box. With 15 or more, an Apply settings to dropdown appears instead. Select a column from it and enter the width. Columns that already have a custom width are marked with an asterisk.
A width box that shows (auto) means that column still follows the auto-size behavior. You can combine the two. For example, use Fixed width with a default of 90 pixels for the numbers, and a custom width of 200 pixels for the name column.
To undo custom widths, clear the box for one column, or turn Custom widths off to reset every column.
Fixed widths in a matrix with column hierarchies
In a matrix with a hierarchy on columns, such as Month and then Net and Gross, Custom widths by default sets one width for the lowest level. So every Net column and every Gross column is sized together. To size each combination separately, such as one month's Net column on its own, turn on More granular. Each leaf-level combination then gets its own width box.
Resizing columns by hand
You can still drag a column edge. Hover just to the right of a column header until the resize arrows appear, then drag. You can also select a column and choose Widen column or Narrow column to change it by 10 pixels.
Manual resizes are saved as custom widths, so they show up in the Custom widths settings. You can fine-tune them there to the exact pixel.
Setting column widths with conditional formatting
Both Default width and each custom width have an fx button. Select it to base the width on a rule, a field value or a measure.
In a matrix that splits values by a category, such as month, a width measure on the less granular setting uses the measure's total for the whole matrix. It does not use each month's own value. Apply the formatting to a specific category's width if you need that category's total instead.
Column widths on mobile
The Column width settings can be set separately in the mobile layout of a report page. That lets you narrow columns so a table fits a phone screen without changing the desktop layout. To hide a column on mobile only, set its width to 0 in the mobile view. The desktop layout keeps the column.
Things to know
Power BI works out cell sizes from the first 20 columns and the first 50 rows. Content outside that range may not be sized correctly under automatic sizing, which is another reason to set widths yourself on large tables.
A fixed width does not adjust to the values. Check the widest likely value, such as a year-end total, before you settle on a width.
For documents that need exact, printed layouts with many pages, a paginated report gives more control than a table visual.
For more on laying out report pages, see our guide to dashboard layout and formatting. For building a report from the start, see building Power BI reports step by step.
The older workaround
Before the Fixed width option existed, a common trick was to rename every column to a placeholder the same length as its longest value. You turned auto-size width off and on again so the columns took the placeholder's width, then renamed the columns back. The widths stayed. This still works, but it breaks as soon as values grow, and it takes much longer than the Format pane setting. Use Fixed width instead.
FAQs
How do I lock column width in Power BI?
Select the visual and open Format your visual > Visual > Layout > Column width. Set Auto-size behavior to Fixed width and enter a Default width. For different widths per column, turn on Custom widths and set each one. The widths then stay the same when filters or data change.
Why do my Power BI table columns keep resizing?
The visual is set to size columns from their content. When filters change the values, the widths change with them. Switch Auto-size behavior from Fit to content to Fixed width, or set custom widths for the columns that move.
How do I make a Power BI table fit the width of the visual?
Set Auto-size behavior to Grow to fit. Columns then expand to fill the visual container, and any leftover space is shared evenly between them.
Sources
Create and format table visualizations in Power BI - Microsoft Learn
Related to Reports and Dashboards