DAX and Data Modeling
Written By: Sajagan Thirugnanam
Last Updated on September 23, 2026
SUM adds up the values in one column. SUMX takes a table and an expression, calculates the expression once for every row of that table, and then adds up the results. Use SUM when the number you need already exists in a column, and SUMX when each row needs its own calculation first, such as quantity times price.
Both are DAX functions, and both return a single number that respects the filters in the visual.
What are Power BI's SUM and SUMX?
The difference is easiest to see with one dataset used for both. The examples below use a table named score, with one row per customer and columns including Health Score and CSM Sentiment.
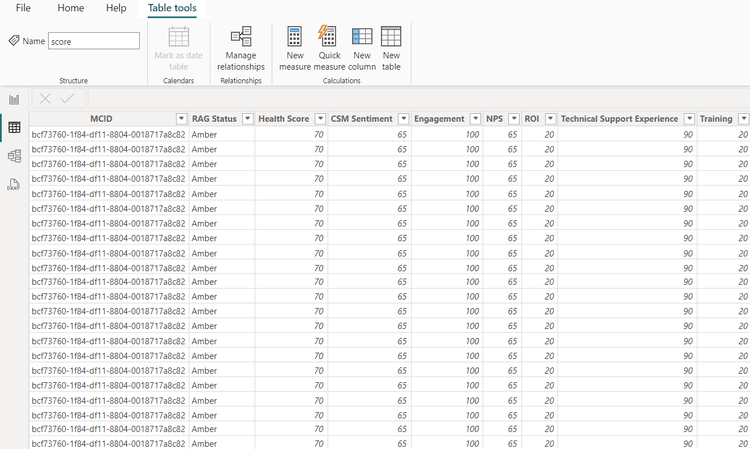
Table view of the score table used in the examples.
Sum Function Explained
SUM takes exactly one column and returns the total of its numbers in the current filter context.
To add up the Health Score column:
![Power BI Desktop formula bar with the measure Total Health Score = sum(score[Health Score]) and a gauge visual below showing 2M](https://framerusercontent.com/images/MW2uJPBt1cftKh1MdLh9YnyZ6Ks.png)
The Total Health Score measure in the formula bar, shown in a gauge visual.
SUM cannot take an expression. SUM ( score[Health Score] - score[CSM Sentiment] ) is an error, because the argument must be a column reference.
Sumx Function Explained
SUMX is an iterator. It walks through a table one row at a time, evaluates an expression for that row, and adds the results.
To add up the difference between Health Score and CSM Sentiment, called Net Score here:
![Power BI Desktop formula bar with the measure Net Score = sumx(score, score[Health Score]-score[CSM Sentiment]) and a gauge visual below showing 112K](https://framerusercontent.com/images/c4KYD3L6dNgg6ASbAicM05w9cb8.png)
The Net Score measure using SUMX, shown in the same gauge visual.
For each row, SUMX subtracts CSM Sentiment from Health Score, then adds up all the row results. With illustrative values, the per-row step looks like this:
Health Score | CSM Sentiment | Net Score for the row |
|---|---|---|
70 | 55 | 15 |
70 | 50 | 20 |
65 | 50 | 15 |
60 | 35 | 25 |
SUMX returns 75, the sum of the last column.
When SUM and SUMX give the same answer
For a plus or minus, you do not need SUMX. Adding up row-level differences gives the same total as subtracting one column total from the other:
With the four rows above, that is 265 minus 190, which is also 75.
When only SUMX gives the right answer
The results diverge when the row calculation multiplies or divides. Take a Sales table with Quantity and Unit Price:
Order | Quantity | Unit Price | Row revenue |
|---|---|---|---|
A | 1 | 100 | 100 |
B | 10 | 5 | 50 |
Revenue is 150. The correct measure is:
Multiplying the two totals instead gives 11 times 105, which is 1,155:
That is the case SUMX exists for. The alternative is a Revenue column computed per row, which the measures vs calculated columns post compares.
Best Practices While Using The SUMX Function
Avoid Overusing SUMX
If the value already exists in a column, use SUM. SUMX ( Sales, Sales[Amount] ) returns the same result as SUM ( Sales[Amount] ) and is harder to read.
SUMX is not slow in itself. A simple expression over columns of one table, like Quantity times Unit Price, is handled efficiently by the engine. It gets expensive when the expression does heavy work on every row, for example calling a measure, using IF logic, or looking up values in other tables, over millions of rows.
Tips To Optimize Performance While Using SUMX
Iterate the smallest table that answers the question.
SUMX ( VALUES ( Customer[CustomerKey] ), ... )walks customers, not every sales line.Keep the row expression to plain column arithmetic where you can.
Store repeated results in variables so they are calculated once.
The DAX performance guide shows how to measure whether a SUMX measure is the slow one.
How Does This Help While Using Other DAX Functions?
SUMX is one of a family of iterators. Most common aggregations have an X version that takes a table and an expression:
Aggregator | Iterator | Example use |
|---|---|---|
AVERAGE | AVERAGEX | Average order value across orders |
COUNT | COUNTX | Count rows where an expression is not blank |
MIN / MAX | MINX / MAXX | Largest single-order revenue |
PRODUCT | PRODUCTX | Compounding growth rates |
RANKX works the same way: it iterates a table and ranks each row by an expression. The RANKX guide covers it. Once you know how SUMX iterates, all of these read the same way.
Conclusion
Use SUM when the value is already in one column. Use SUMX when each row needs a calculation that involves multiplication, division or conditional logic before adding up. For plain addition or subtraction of columns, SUM of each column is enough. To see how SUMX combines with filters, read the CALCULATE function guide next.
FAQs
What is DAX?
DAX (Data Analysis Expressions) is the formula language of Power BI, Analysis Services and Power Pivot in Excel. You use it to write measures, calculated columns and calculated tables. SUM, SUMX and CALCULATE are DAX functions. The complete DAX guide introduces the main ones.
Sources
SUMX function (DAX) - Microsoft Learn
SUM function (DAX) - Microsoft Learn
Related to DAX and Data Modeling