Reporting and KPIs
Power BI Filters vs Slicers: The Difference and When to Use Them
Filters and slicers both narrow what a Power BI visual shows. A filter lives in the Filters pane, a slicer sits on the canvas. When to use each.
Sajagan Thirugnanam
·
Updated
A Power BI filter is a background rule applied through the collapsible Filter pane; a slicer is a visual that sits on the report canvas and lets a reader filter data by clicking it directly. Filters cover more condition types and every scope level; slicers are more visible and easier for a casual reader to use without hunting for a side panel.
Power BI Filters
A filter narrows the rows a visual, page, or report shows, based on a condition you set. You build filters in the Filter pane by dragging a field into one of three wells:
Filters on this visual. Applies to the single selected visual only. Use this to show, for example, only the top 5 products in one chart without affecting anything else on the page.
Filters on this page. Applies to every visual on the current page. Use this for a page built around one constraint, such as a single year of sales.
Filters on all pages. Applies to every page in the report, sometimes called a report-level filter. Use this for a constraint that should hold everywhere, such as restricting the entire report to one region.
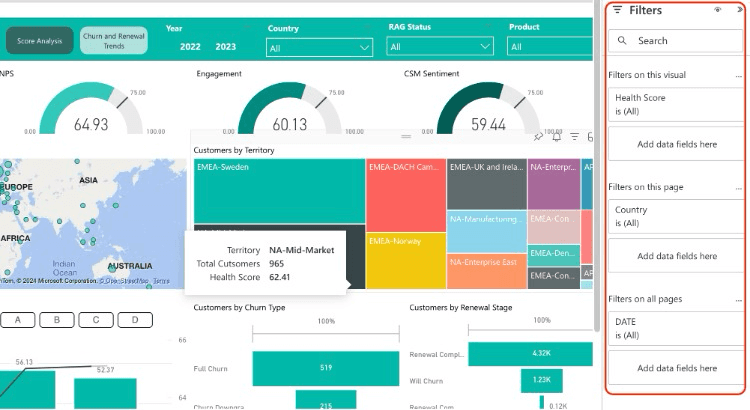
The Filter pane's three wells: visual, page, and report (all pages).
A report-level filter is easy for a reader to forget exists, since it applies everywhere and shows in only one place. If someone reports missing data that should be there, check the report-level filters before assuming the data itself is missing. You can also hide a filter from readers with the eye icon next to it, useful when you want the constraint enforced but don't want it visible or editable.
Filter Condition Types
The condition options in the Filter pane change with the field's data type. Selecting a field opens a Filter type dropdown offering Basic filtering, Advanced filtering, Relative date, and Relative time (the last two only appear for date and time fields). Top N is also available, but only as a visual-level filter.
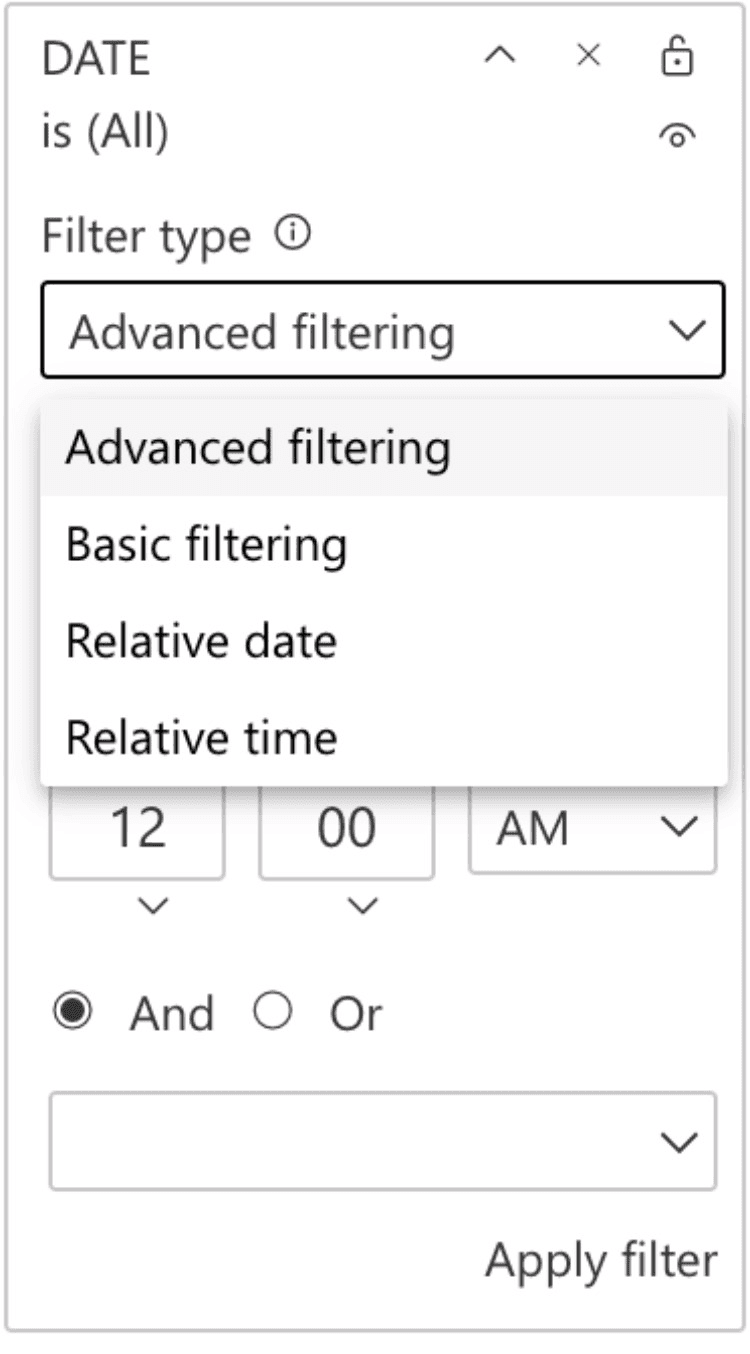
The Filter type dropdown. The options offered depend on the field's data type and where you're filtering.
For a number field, Advanced filtering offers these conditions:
is less than
is less than or equal to
is greater than
is greater than or equal to
is
is not
is blank
is not blank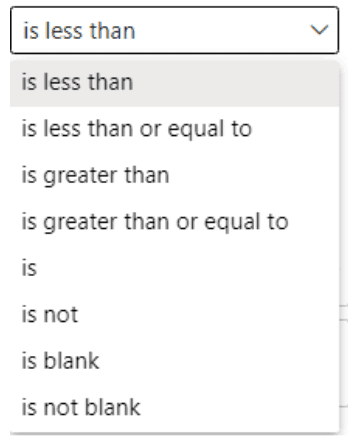
The condition list for a number field under Advanced filtering.
A text field offers a similar list built around contains, starts with, and is blank, and a date field adds before/after comparisons alongside Relative date, which covers phrases such as "in the last 30 days" without a manual date update. Relative date and Relative time suit an operational report that needs to stay current without anyone touching the filter.
What Slicers Are
A slicer is a visual, not a background rule. It appears on the report canvas as a list, dropdown, or range control, and a reader filters the data by clicking or selecting directly inside it, with no side panel to open.
Because a slicer is a visual, adding one to a page triggers a query every time a reader interacts with it, the same way any other visual does. A page with many slicers, or slicers on a very large table, can be slower to respond than the same constraint applied as a filter. Add fields to a slicer from the Visualizations pane like any other visual.
Slicers can also be synced across pages, from View > Sync slicers, so a selection made on one page carries to every page you choose, without adding the same slicer to each page separately.
When to Use Which
Use a slicer for the two or three inputs a reader changes most often, such as date range or region, since it's visible without opening anything. Use the Filter pane for everything else: structural rules the reader shouldn't touch, advanced conditions like Top N or a specific number range, and any filter that would otherwise crowd the canvas with controls.
Filters and slicers stack. A report-level filter, a page-level filter, and a slicer can all apply to the same visual at once, and Power BI applies all of them together. If a number looks wrong, check each level in turn rather than assuming only one is active.
For the full breakdown of filter scope and DAX-driven filtering with CALCULATE, see our complete guide to Power BI filters. If a report needs to switch which measure or dimension a visual shows rather than which rows are visible, that's a field parameter, not a filter or a slicer. For sending a reader to a separate detail page instead of narrowing the current one, see our guide to drill-through.
FAQs
Can a slicer filter another slicer?
Yes, if they're built from related fields. Selecting a country in one slicer can narrow the options shown in a second slicer for city, the same way any filter narrows related data, as long as the underlying tables have a relationship between them.
Do slicers apply to every page in the report?
Only if you sync them. A slicer you add to one page affects that page alone by default. Turn on sync from View > Sync slicers to apply the same slicer selection across the pages you choose.
Sources
Filter types in Power BI reports - Microsoft Learn
Add a filter to a report - Microsoft Learn
Sync slicers in Power BI reports - Microsoft Learn
A Power BI filter is a background rule applied through the collapsible Filter pane; a slicer is a visual that sits on the report canvas and lets a reader filter data by clicking it directly. Filters cover more condition types and every scope level; slicers are more visible and easier for a casual reader to use without hunting for a side panel.
Power BI Filters
A filter narrows the rows a visual, page, or report shows, based on a condition you set. You build filters in the Filter pane by dragging a field into one of three wells:
Filters on this visual. Applies to the single selected visual only. Use this to show, for example, only the top 5 products in one chart without affecting anything else on the page.
Filters on this page. Applies to every visual on the current page. Use this for a page built around one constraint, such as a single year of sales.
Filters on all pages. Applies to every page in the report, sometimes called a report-level filter. Use this for a constraint that should hold everywhere, such as restricting the entire report to one region.
The Filter pane's three wells: visual, page, and report (all pages).
A report-level filter is easy for a reader to forget exists, since it applies everywhere and shows in only one place. If someone reports missing data that should be there, check the report-level filters before assuming the data itself is missing. You can also hide a filter from readers with the eye icon next to it, useful when you want the constraint enforced but don't want it visible or editable.
Filter Condition Types
The condition options in the Filter pane change with the field's data type. Selecting a field opens a Filter type dropdown offering Basic filtering, Advanced filtering, Relative date, and Relative time (the last two only appear for date and time fields). Top N is also available, but only as a visual-level filter.
The Filter type dropdown. The options offered depend on the field's data type and where you're filtering.
For a number field, Advanced filtering offers these conditions:
is less than
is less than or equal to
is greater than
is greater than or equal to
is
is not
is blank
is not blank
The condition list for a number field under Advanced filtering.
A text field offers a similar list built around contains, starts with, and is blank, and a date field adds before/after comparisons alongside Relative date, which covers phrases such as "in the last 30 days" without a manual date update. Relative date and Relative time suit an operational report that needs to stay current without anyone touching the filter.
What Slicers Are
A slicer is a visual, not a background rule. It appears on the report canvas as a list, dropdown, or range control, and a reader filters the data by clicking or selecting directly inside it, with no side panel to open.
Because a slicer is a visual, adding one to a page triggers a query every time a reader interacts with it, the same way any other visual does. A page with many slicers, or slicers on a very large table, can be slower to respond than the same constraint applied as a filter. Add fields to a slicer from the Visualizations pane like any other visual.
Slicers can also be synced across pages, from View > Sync slicers, so a selection made on one page carries to every page you choose, without adding the same slicer to each page separately.
When to Use Which
Use a slicer for the two or three inputs a reader changes most often, such as date range or region, since it's visible without opening anything. Use the Filter pane for everything else: structural rules the reader shouldn't touch, advanced conditions like Top N or a specific number range, and any filter that would otherwise crowd the canvas with controls.
Filters and slicers stack. A report-level filter, a page-level filter, and a slicer can all apply to the same visual at once, and Power BI applies all of them together. If a number looks wrong, check each level in turn rather than assuming only one is active.
For the full breakdown of filter scope and DAX-driven filtering with CALCULATE, see our complete guide to Power BI filters. If a report needs to switch which measure or dimension a visual shows rather than which rows are visible, that's a field parameter, not a filter or a slicer. For sending a reader to a separate detail page instead of narrowing the current one, see our guide to drill-through.
FAQs
Can a slicer filter another slicer?
Yes, if they're built from related fields. Selecting a country in one slicer can narrow the options shown in a second slicer for city, the same way any filter narrows related data, as long as the underlying tables have a relationship between them.
Do slicers apply to every page in the report?
Only if you sync them. A slicer you add to one page affects that page alone by default. Turn on sync from View > Sync slicers to apply the same slicer selection across the pages you choose.
Sources
Filter types in Power BI reports - Microsoft Learn
Add a filter to a report - Microsoft Learn
Sync slicers in Power BI reports - Microsoft Learn
Show us your report nobody trusts.
1 · A 30-minute call.
2 · We look at your current reports together.
3 · We tell you what we would do.
Show us your report nobody trusts.
1 · A 30-minute call.
2 · We look at your current reports together.
3 · We tell you what we would do.
Show us your report nobody trusts.
1 · A 30-minute call.
2 · We look at your current reports together.
3 · We tell you what we would do.

CaseWhen is a Berlin BI consultancy that builds reporting that leaders can trust, on the Microsoft stack: Power BI, Fabric and Azure.
Berlin, Germany
Free tools
CaseWhen is a Berlin BI consultancy that builds reporting that leaders can trust, on the Microsoft stack: Power BI, Fabric and Azure.
Berlin, Germany
Free tools
CaseWhen is a Berlin BI consultancy that builds reporting that leaders can trust, on the Microsoft stack: Power BI, Fabric and Azure.
Berlin, Germany