Fabric and Azure
How to Clean and Transform Data with Power Query in Power BI
Power Query is Power BI's data prep engine. How to clean, merge and transform data with the M language, with a full worked merge example.
Austin Levine
·
Updated
Power Query is Power BI's data preparation engine, built into Power BI Desktop and Excel. You use it to connect to a data source, then clean, reshape, merge and transform that data with the M language before it loads into your report's data model. Every click in the Power Query editor records as one line of M, which you can read, edit or write by hand.
What Power Query does
Power Query sits between your source data and your report. You point it at a source (a database, a folder of CSV files, an API, an Excel workbook), and it opens a preview of that data in its own editor. Each transformation you apply, such as removing a column or filtering rows, appears as a named step in the Applied Steps pane on the right, in order.
Each step is a line of M code, and Power Query runs every one of them again on each refresh. Selecting View > Advanced Editor shows the full let expression behind any query, where each step feeds into the next.
Cleaning data
Common cleaning steps, and the M functions behind them:
Remove rows with errors:
Table.RemoveRowsWithErrors(Source, {"ColumnName"})Remove duplicate rows:
Table.Distinct(Source)Filter out blanks:
Table.SelectRows(Source, each [ColumnName] <> null)Fix a data type:
Table.TransformColumnTypes(Source, {{"OrderDate", type date}})
Applying these through the ribbon (Home > Remove Rows, Home > Remove Duplicates, a column header's filter arrow, or a column header's type icon) writes the same functions automatically. Both routes produce identical M code. If the same cleaned query needs to run on a schedule and feed several reports, consider building it as a Power BI dataflow instead of a query saved inside one report.
Merging data: a worked example
Say you have a Products query with ProductID, ProductName, CategoryID and QuantityPerUnit, and a separate TotalSales query with ProductID, Year and Total Sales already aggregated by product and year. Merging joins them on the shared ProductID column:
let
    Source = Products,
    MergedWithSales = Table.NestedJoin(
        Source, {"ProductID"},
        TotalSales, {"ProductID"},
        "TotalSales", JoinKind.LeftOuter
    ),
    ExpandedSales = Table.ExpandTableColumn(
        MergedWithSales, "TotalSales", {"Year", "Total Sales"}, {"Year", "Total Sales"}
    )
in
    ExpandedSales
Table.NestedJoin adds a new column that holds the matching rows from TotalSales as a nested table, one row per match. Table.ExpandTableColumn then pulls the columns you want out of that nested table and flattens them into the main table. A left outer join keeps every product, with blanks where no sales match.
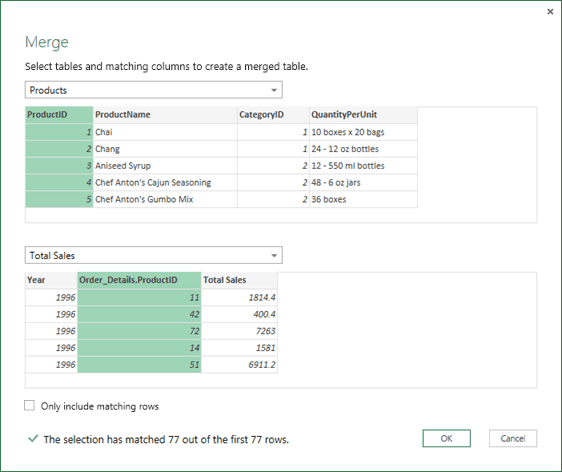
The Merge dialog reached from Home > Merge Queries. Select the matching column in each table, choose a join kind, and select OK to build the nested column the M code above then expands.
Adding a calculated column
To multiply two columns row by row, use Add Column > Custom Column, or write the step directly:
Table.AddColumn(#"Changed Type", "Multiply", each [Quantity] * [Price])each runs the expression once per row, referencing that row's own Quantity and Price values. The result is a new column with no separate formula language to learn beyond M itself.
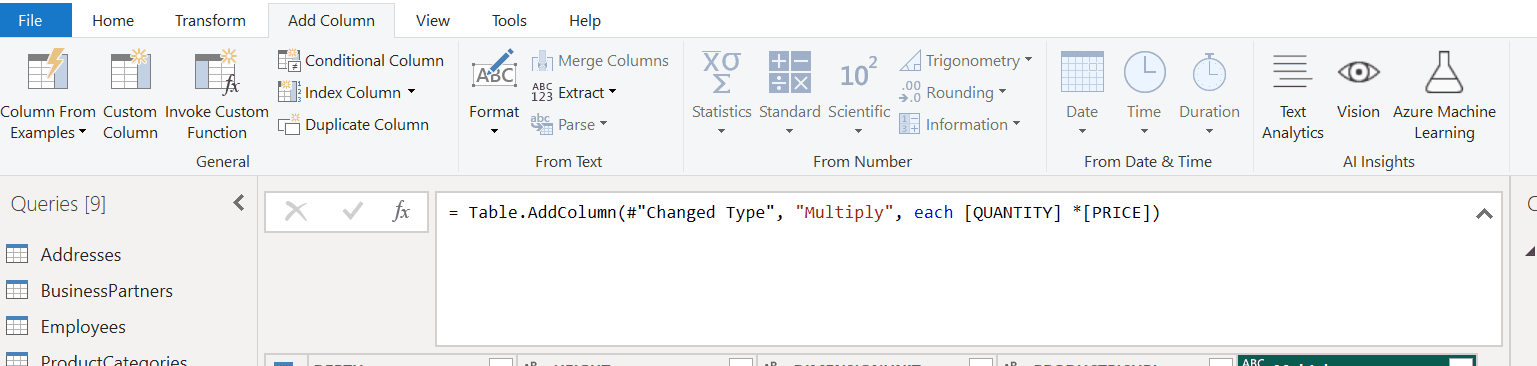
A custom column step written directly in the formula bar, doing the same row-by-row multiplication as the code above.
Automating the result
Once a query's steps are correct, Close & Apply loads the result into your data model, and a scheduled refresh in the Power BI service reruns every step against the live source on the schedule you set. Parameters, set under Home > Manage Parameters, let you swap a file path, date range or server name without editing the query itself, which is useful when the same query needs to run against a test and a production source.
Power Query shapes the data. How you then structure the tables it produces, fact tables, dimension tables, relationships, is a separate decision. See our best practices for data modeling in Power BI and, if the model needs a calendar table, our guide to building a date table from scratch.
Sources
Power Query M function reference - Microsoft Learn
Merge queries overview - Microsoft Learn
Power Query is Power BI's data preparation engine, built into Power BI Desktop and Excel. You use it to connect to a data source, then clean, reshape, merge and transform that data with the M language before it loads into your report's data model. Every click in the Power Query editor records as one line of M, which you can read, edit or write by hand.
What Power Query does
Power Query sits between your source data and your report. You point it at a source (a database, a folder of CSV files, an API, an Excel workbook), and it opens a preview of that data in its own editor. Each transformation you apply, such as removing a column or filtering rows, appears as a named step in the Applied Steps pane on the right, in order.
Each step is a line of M code, and Power Query runs every one of them again on each refresh. Selecting View > Advanced Editor shows the full let expression behind any query, where each step feeds into the next.
Cleaning data
Common cleaning steps, and the M functions behind them:
Remove rows with errors:
Table.RemoveRowsWithErrors(Source, {"ColumnName"})Remove duplicate rows:
Table.Distinct(Source)Filter out blanks:
Table.SelectRows(Source, each [ColumnName] <> null)Fix a data type:
Table.TransformColumnTypes(Source, {{"OrderDate", type date}})
Applying these through the ribbon (Home > Remove Rows, Home > Remove Duplicates, a column header's filter arrow, or a column header's type icon) writes the same functions automatically. Both routes produce identical M code. If the same cleaned query needs to run on a schedule and feed several reports, consider building it as a Power BI dataflow instead of a query saved inside one report.
Merging data: a worked example
Say you have a Products query with ProductID, ProductName, CategoryID and QuantityPerUnit, and a separate TotalSales query with ProductID, Year and Total Sales already aggregated by product and year. Merging joins them on the shared ProductID column:
let
    Source = Products,
    MergedWithSales = Table.NestedJoin(
        Source, {"ProductID"},
        TotalSales, {"ProductID"},
        "TotalSales", JoinKind.LeftOuter
    ),
    ExpandedSales = Table.ExpandTableColumn(
        MergedWithSales, "TotalSales", {"Year", "Total Sales"}, {"Year", "Total Sales"}
    )
in
    ExpandedSales
Table.NestedJoin adds a new column that holds the matching rows from TotalSales as a nested table, one row per match. Table.ExpandTableColumn then pulls the columns you want out of that nested table and flattens them into the main table. A left outer join keeps every product, with blanks where no sales match.
The Merge dialog reached from Home > Merge Queries. Select the matching column in each table, choose a join kind, and select OK to build the nested column the M code above then expands.
Adding a calculated column
To multiply two columns row by row, use Add Column > Custom Column, or write the step directly:
Table.AddColumn(#"Changed Type", "Multiply", each [Quantity] * [Price])each runs the expression once per row, referencing that row's own Quantity and Price values. The result is a new column with no separate formula language to learn beyond M itself.
A custom column step written directly in the formula bar, doing the same row-by-row multiplication as the code above.
Automating the result
Once a query's steps are correct, Close & Apply loads the result into your data model, and a scheduled refresh in the Power BI service reruns every step against the live source on the schedule you set. Parameters, set under Home > Manage Parameters, let you swap a file path, date range or server name without editing the query itself, which is useful when the same query needs to run against a test and a production source.
Power Query shapes the data. How you then structure the tables it produces, fact tables, dimension tables, relationships, is a separate decision. See our best practices for data modeling in Power BI and, if the model needs a calendar table, our guide to building a date table from scratch.
Sources
Power Query M function reference - Microsoft Learn
Merge queries overview - Microsoft Learn
Show us your report nobody trusts.
1 · A 30-minute call.
2 · We look at your current reports together.
3 · We tell you what we would do.
Show us your report nobody trusts.
1 · A 30-minute call.
2 · We look at your current reports together.
3 · We tell you what we would do.
Show us your report nobody trusts.
1 · A 30-minute call.
2 · We look at your current reports together.
3 · We tell you what we would do.

CaseWhen is a Berlin BI consultancy that builds reporting that leaders can trust, on the Microsoft stack: Power BI, Fabric and Azure.
Berlin, Germany
Free tools
CaseWhen is a Berlin BI consultancy that builds reporting that leaders can trust, on the Microsoft stack: Power BI, Fabric and Azure.
Berlin, Germany
Free tools
CaseWhen is a Berlin BI consultancy that builds reporting that leaders can trust, on the Microsoft stack: Power BI, Fabric and Azure.
Berlin, Germany