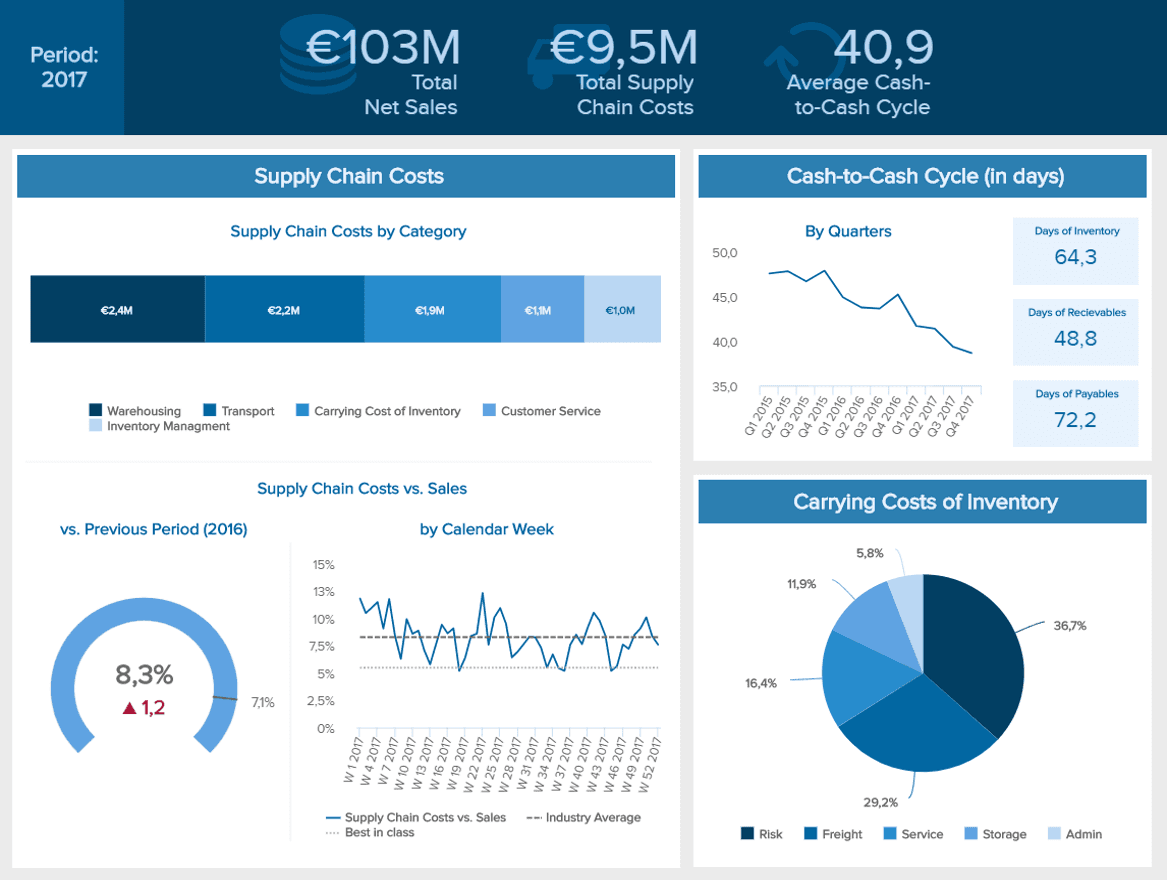
Transforming Data Insights into Strategic Actions for Unmatched Business Intelligence
Enhance Data Visualization: Gain real-time insights with interactive and customizable Power BI dashboards.
Optimize Decision-Making: Streamline business processes and improve performance with data-driven insights.
Predict Future Trends: Utilize Power BI’s predictive analytics to anticipate market changes and drive strategic decisions.
Power BI consultancy involves the implementation, optimization, and customization of Power BI to enable organizations to turn complex data into clear, actionable insights. This practice enables companies to enhance data visualization, optimize decision-making processes, and predict future trends using Power BI’s powerful business intelligence tools.
Example: A retail company using Power BI dashboards to analyze sales trends across regions, leading to more targeted marketing strategies and increased revenue.
Key Components of Power BI Consultancy
Data Integration
Sources: Connect data from CRM systems, ERP platforms, cloud databases, and external sources to Power BI.
Tools: Use Power BI’s data connectors, dataflows, and Power Query to consolidate data into unified, dynamic reports.
Data Visualization
Techniques: Apply data modeling, real-time updates, and custom visuals to create interactive reports and dashboards.
Outcomes: Identify trends, track KPIs, and make data-driven decisions faster and more effectively.
10 KPIs of Power BI Consultancy
Enhanced Data Visualization
Enhanced data visualization involves using Power BI to transform complex data into easy-to-understand charts, graphs, and dashboards. Power BI allows businesses to visualize key metrics, monitor trends, and communicate insights across departments.
Example: Implementing Power BI dashboards to monitor KPIs such as sales performance, customer satisfaction, and financial metrics, leading to more transparent reporting and data-driven decisions.
Benefit: Enhanced visualization of data helps businesses quickly identify trends and patterns, improving decision-making processes across teams.
Optimized Decision-Making
Optimizing decision-making means using Power BI’s data visualization and reporting features to streamline processes and enhance strategic planning. Power BI helps businesses identify performance bottlenecks, track progress toward goals, and make informed decisions based on real-time data.
Example: Using Power BI to visualize project timelines, budgets, and resource allocation, enabling project managers to make data-driven adjustments and improve project outcomes.
Benefit: Data-driven insights provided by Power BI lead to faster, more accurate decision-making, improving overall business performance.
Predicting Future Trends
Predicting future trends involves using Power BI’s predictive analytics features to forecast changes in the market, customer behavior, or operational performance. Power BI can model future scenarios based on historical data, helping businesses stay ahead of trends and adapt proactively.
Example: Applying predictive analytics in Power BI to forecast customer demand for the next quarter, enabling businesses to adjust their production and marketing strategies.
Benefit: Proactive forecasting through Power BI helps businesses make more informed strategic decisions and stay competitive in rapidly changing markets.
By leveraging Power BI consultancy, organizations can gain critical insights, optimize operations, and predict future trends more effectively, leading to improved business performance, faster decision-making, and a competitive advantage.
At CaseWhen, we redefine Power BI consultancy with an innovative methodology that surpasses traditional approaches. Our blend of advanced data visualization techniques and business intelligence expertise provides actionable insights that drive strategic decisions across departments.
What sets CaseWhen apart is the integration of cutting-edge analytics with deep supply chain knowledge. This powerful combination offers a comprehensive understanding of your unique supply chain challenges and opportunities, enabling us to develop tailored solutions that deliver measurable results.
Recognizing that one-size-fits-all doesn’t work in data analytics, CaseWhen designs customized Power BI solutions that align with your specific business goals and needs. Whether you need real-time performance tracking, advanced data modeling, or predictive analytics, we ensure our Power BI solutions are tailored to meet your objectives.
Tailored Strategies: Solutions designed to meet your specific Power BI needs.
Expert Insights: Leverage our deep industry knowledge for a competitive edge.
Proven Results: Enhance data visualization and operational efficiency with Power BI-driven decisions.
Unlock the full potential of your data with CaseWhen’s Power BI Consultancy Service. Let us help you transform raw data into clear, actionable insights that drive your business forward.
Need Professional Help with Power BI Implementation?
Explore how we can empower your team and drive your business forward with Power BI.
Berlin, DE


