Transforming Data Insights into Strategic Actions for Unmatched Business Visibility
Enhance Data Clarity: Gain real-time insights with interactive, customizable dashboards.
Optimize Decision-Making: Streamline operations and improve business strategies with intuitive visual reports.
Track Key Metrics: Utilize dashboards to monitor business performance and predict future trends.
Dashboard consulting involves designing and implementing customized, data-driven dashboards that provide clear and actionable insights for decision-making. This practice enables organizations to enhance data visibility, optimize decision-making processes, and track key metrics in real time.
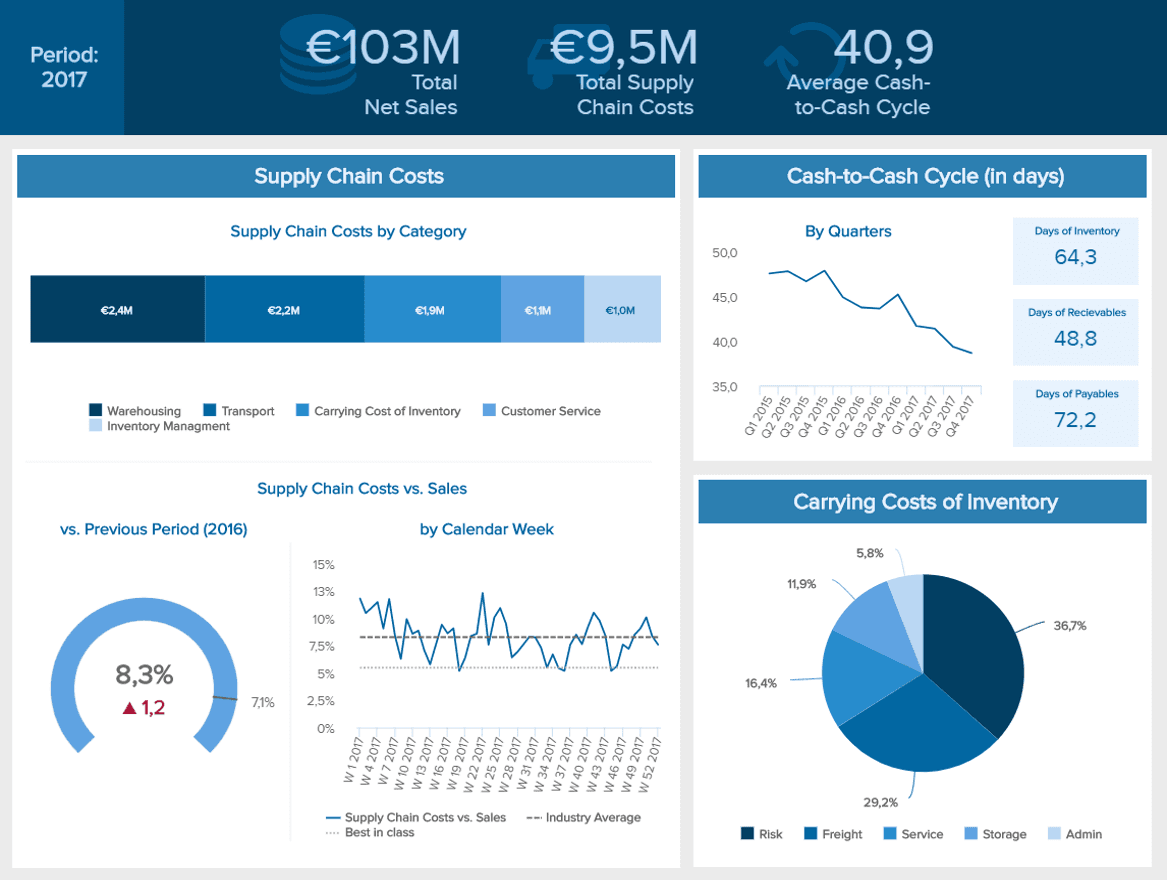
Example: A manufacturing company using dashboard consulting to visualize production data, enabling the management team to monitor performance and optimize resources.
Key Components of Dashboard Consulting
Data Collection
Sources: Gather data from business systems, databases, CRM platforms, and external sources.
Tools: Use dashboard software like Power BI, Tableau, and custom-built tools to create real-time visualizations.
Data Analysis
Techniques: Apply filtering, aggregation, and data blending to display relevant KPIs and trends.
Outcomes: Identify trends, track performance, and support data-driven decision-making.
10 KPIs of Supply Chain Analytics
Enhanced Data Clarity
Enhanced data clarity involves using dashboards to transform complex data into easy-to-understand visualizations. Dashboards help teams track KPIs, monitor trends, and identify opportunities for improvement.
Example: Implementing an interactive dashboard for sales teams to monitor real-time sales performance, revenue growth, and customer engagement, leading to better decision-making and resource allocation.
Benefit: Enhanced visibility into data enables teams to quickly interpret insights and make faster, more informed business decisions.
Optimized Decision-Making
Optimized decision-making means using dashboards to streamline operations and improve business strategies. Dashboards can reveal performance bottlenecks, track key metrics, and provide decision-makers with the insights they need.
Example: Using a customized dashboard to visualize project timelines and budgets, enabling project managers to identify risks and ensure that resources are allocated effectively.
Benefit: Better dashboard insights lead to faster decision-making, improved business outcomes, and more effective resource management.
Tracking Key Metrics
Tracking key metrics involves using dashboards to monitor business performance across various functions. Dashboards can display KPIs in real-time, track progress towards goals, and predict future trends.
Example: Implementing dashboards that track customer satisfaction, churn rates, and marketing performance, enabling businesses to adjust strategies based on data trends.
Benefit: Real-time tracking of metrics allows businesses to stay agile, respond to challenges proactively, and capitalize on growth opportunities.
By leveraging dashboard consulting, organizations can gain critical insights, track performance, and optimize decision-making processes, leading to improved business efficiency, visibility, and competitive advantage.
At CaseWhen, we redefine dashboard consulting with an innovative methodology that surpasses traditional approaches. Our blend of advanced data visualization techniques and industry expertise provides clear, actionable insights that drive strategic business decisions.
What sets CaseWhen apart is the integration of cutting-edge dashboard tools with deep business knowledge. This powerful combination offers a comprehensive understanding of your unique data challenges and opportunities, enabling us to develop tailored dashboard solutions that deliver measurable results.
Recognizing that one-size-fits-all doesn’t work in dashboard consulting, CaseWhen designs customized dashboards that align with your specific business goals and requirements. Whether you need performance tracking, KPI monitoring, or comprehensive business reporting, we ensure our dashboards are tailored to meet your business objectives.


Tailored Strategies: Solutions designed to meet your specific dashboard needs
Expert Insights: Leverage our deep industry knowledge for a competitive edge.
Proven Results: Enhance decision-making and operational efficiency with data-driven dashboards.
Unlock the full potential of your data with CaseWhen’s Dashboard Consulting Service. Let us help you transform raw data into clear, actionable insights that drive your business forward.